MetLife 2013 Annual Report Download - page 130
Download and view the complete annual report
Please find page 130 of the 2013 MetLife annual report below. You can navigate through the pages in the report by either clicking on the pages listed below, or by using the keyword search tool below to find specific information within the annual report.-
 1
1 -
2
-
3
-
4
-
5
-
6
-
7
-
8
-
9
-
10
-
11
-
12
-
13
-
14
-
15
-
16
-
17
-
18
-
19
-
20
-
21
-
22
-
23
-
24
-
25
-
26
-
27
-
28
-
29
-
30
-
31
-
32
-
33
-
34
-
35
-
36
-
37
-
38
-
39
-
40
-
41
-
42
-
43
-
44
-
45
-
46
-
47
-
48
-
49
-
50
-
51
-
52
-
53
-
54
-
55
-
56
-
57
-
58
-
59
-
60
-
61
-
62
-
63
-
64
-
65
-
66
-
67
-
68
-
69
-
70
-
71
-
72
-
73
-
74
-
75
-
76
-
77
-
78
-
79
-
80
-
81
-
82
-
83
-
84
-
85
-
86
-
87
-
88
-
89
-
90
-
91
-
92
-
93
-
94
-
95
-
96
-
97
-
98
-
99
-
100
-
101
-
102
-
103
-
104
-
105
-
106
-
107
-
108
-
109
-
110
-
111
-
112
-
113
-
114
-
115
-
116
-
117
-
118
-
119
-
 120
120 -
 121
121 -
 122
122 -
 123
123 -
 124
124 -
 125
125 -
 126
126 -
 127
127 -
 128
128 -
 129
129 -
 130
130 -
 131
131 -
 132
132 -
 133
133 -
 134
134 -
 135
135 -
 136
136 -
 137
137 -
 138
138 -
 139
139 -
 140
140 -
141
-
142
-
143
-
144
-
145
-
146
-
147
-
148
-
149
-
150
-
151
-
152
-
153
-
154
-
155
-
156
-
157
-
158
-
159
-
160
-
161
-
162
-
163
-
164
-
165
-
166
-
167
-
168
-
169
-
170
-
171
-
172
-
173
-
174
-
175
-
176
-
177
-
178
-
179
-
180
-
181
-
182
-
183
-
184
-
185
-
186
-
187
-
188
-
189
-
190
-
191
-
192
-
193
-
194
-
195
-
196
-
197
-
198
-
199
-
200
-
201
-
202
-
203
-
204
-
205
-
206
-
207
-
208
-
209
-
210
-
211
-
212
-
213
-
214
-
215
-
216
-
217
-
218
-
219
-
220
-
221
-
222
-
223
-
224
 |
 |

MetLife, Inc.
Notes to the Consolidated Financial Statements — (Continued)
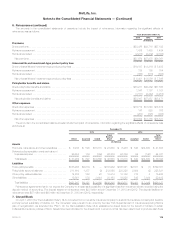
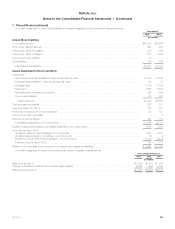
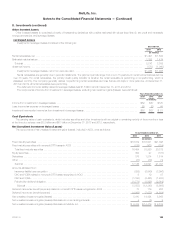
7. Closed Block (continued)
Information regarding the closed block revenues and expenses was as follows:
Years Ended December 31,
2013 2012 2011
(In millions)
Revenues
Premiums ....................................................................................... $1,987 $2,139 $2,306
Net investment income ............................................................................. 2,130 2,188 2,231
Net investment gains (losses) ........................................................................ 25 61 32
Net derivative gains (losses) ......................................................................... (6) (12) 8
Total revenues ............................................................................... 4,136 4,376 4,577
Expenses
Policyholder benefits and claims ...................................................................... 2,702 2,783 2,991
Policyholder dividends ............................................................................. 979 1,072 1,137
Other expenses .................................................................................. 165 179 193
Total expenses .............................................................................. 3,846 4,034 4,321
Revenues, net of expenses before provision for income tax expense (benefit) .................................. 290 342 256
Provision for income tax expense (benefit) .............................................................. 101 120 89
Revenues, net of expenses and provision for income tax expense (benefit) from continuing operations ............... 189 222 167
Revenues, net of expenses and provision for income tax expense (benefit) from discontinued operations ............. — 10 1
Revenues, net of expenses and provision for income tax expense (benefit) .................................... $ 189 $ 232 $ 168
MLIC charges the closed block with federal income taxes, state and local premium taxes and other additive state or local taxes, as well as
investment management expenses relating to the closed block as provided in the Plan. MLIC also charges the closed block for expenses of maintaining
the policies included in the closed block.
8. Investments
See Note 10 for information about the fair value hierarchy for investments and the related valuation methodologies.
Investment Risks and Uncertainties
Investments are exposed to the following primary sources of risk: credit, interest rate, liquidity, market valuation, currency and real estate risk. The
financial statement risks, stemming from such investment risks, are those associated with the determination of estimated fair values, the diminished
ability to sell certain investments in times of strained market conditions, the recognition of impairments, the recognition of income on certain investments
and the potential consolidation of VIEs. The use of different methodologies, assumptions and inputs relating to these financial statement risks may have
a material effect on the amounts presented within the consolidated financial statements.
The determination of valuation allowances and impairments is highly subjective and is based upon periodic evaluations and assessments of known
and inherent risks associated with the respective asset class. Such evaluations and assessments are revised as conditions change and new information
becomes available.
The recognition of income on certain investments (e.g. structured securities, including mortgage-backed securities, asset-backed securities (“ABS”),
certain structured investment transactions and FVO and trading securities) is dependent upon certain factors such as prepayments and defaults, and
changes in such factors could result in changes in amounts to be earned.
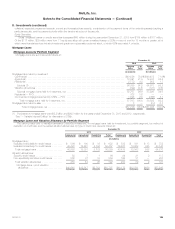
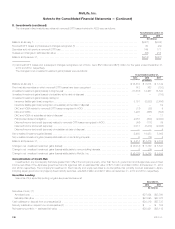
Fixed Maturity and Equity Securities AFS
Fixed Maturity and Equity Securities AFS by Sector
The following table presents the fixed maturity and equity securities AFS by sector. Redeemable preferred stock is reported within U.S. corporate
and foreign corporate fixed maturity securities and non-redeemable preferred stock is reported within equity securities. Included within fixed maturity
securities are structured securities including RMBS, commercial mortgage-backed securities (“CMBS”) and ABS.
December 31, 2013 December 31, 2012
Cost or
Amortized
Cost
Gross Unrealized Estimated
Fair
Value
Cost or
Amortized
Cost
Gross Unrealized Estimated
Fair
ValueGains Temporary
Losses OTTI
Losses Gains Temporary
Losses OTTI
Losses
(In millions)
Fixed maturity securities
U.S. corporate .......................... $100,203 $ 7,495 $1,229 $ — $106,469 $102,669 $11,887 $ 430 $ — $114,126
Foreign corporate (1) ..................... 59,778 3,939 565 — 63,152 61,806 5,654 277 (1) 67,184
Foreign government ...................... 50,717 4,107 387 — 54,437 51,967 5,440 71 — 57,336
U.S. Treasury and agency ................. 43,928 2,251 1,056 — 45,123 41,874 6,104 11 — 47,967
RMBS ................................ 34,167 1,584 490 206 35,055 35,666 2,477 315 349 37,479
CMBS ................................ 16,115 605 170 — 16,550 18,177 1,009 57 — 19,129
ABS .................................. 15,458 296 171 12 15,571 15,762 404 156 13 15,997
State and political subdivision .............. 13,233 903 306 — 13,830 12,949 2,169 70 — 15,048
Total fixed maturity securities .............. $333,599 $21,180 $4,374 $218 $350,187 $340,870 $35,144 $1,387 $361 $374,266
Equity securities
Common stock ......................... $ 1,927 $ 431 $ 5 $ — $ 2,353 $ 2,034 $ 147 $ 19 $ — $ 2,162
Non-redeemable preferred stock ............ 1,085 76 112 — 1,049 804 65 140 — 729
Total equity securities ................... $ 3,012 $ 507 $ 117 $ — $ 3,402 $ 2,838 $ 212 $ 159 $ — $ 2,891
122 MetLife, Inc.