MetLife 2013 Annual Report Download - page 25
Download and view the complete annual report
Please find page 25 of the 2013 MetLife annual report below. You can navigate through the pages in the report by either clicking on the pages listed below, or by using the keyword search tool below to find specific information within the annual report.-
 1
1 -
2
-
3
-
4
-
5
-
6
-
7
-
8
-
9
-
10
-
11
-
12
-
13
-
14
-
 15
15 -
 16
16 -
 17
17 -
 18
18 -
 19
19 -
 20
20 -
 21
21 -
 22
22 -
 23
23 -
 24
24 -
 25
25 -
 26
26 -
 27
27 -
 28
28 -
 29
29 -
 30
30 -
 31
31 -
 32
32 -
 33
33 -
 34
34 -
 35
35 -
36
-
37
-
38
-
39
-
40
-
41
-
42
-
43
-
44
-
45
-
46
-
47
-
48
-
49
-
50
-
51
-
52
-
53
-
54
-
55
-
56
-
57
-
58
-
59
-
60
-
61
-
62
-
63
-
64
-
65
-
66
-
67
-
68
-
69
-
70
-
71
-
72
-
73
-
74
-
75
-
76
-
77
-
78
-
79
-
80
-
81
-
82
-
83
-
84
-
85
-
86
-
87
-
88
-
89
-
90
-
91
-
92
-
93
-
94
-
95
-
96
-
97
-
98
-
99
-
100
-
101
-
102
-
103
-
104
-
105
-
106
-
107
-
108
-
109
-
110
-
111
-
112
-
113
-
114
-
115
-
116
-
117
-
118
-
119
-
120
-
121
-
122
-
123
-
124
-
125
-
126
-
127
-
128
-
129
-
130
-
131
-
132
-
133
-
134
-
135
-
136
-
137
-
138
-
139
-
140
-
141
-
142
-
143
-
144
-
145
-
146
-
147
-
148
-
149
-
150
-
151
-
152
-
153
-
154
-
155
-
156
-
157
-
158
-
159
-
160
-
161
-
162
-
163
-
164
-
165
-
166
-
167
-
168
-
169
-
170
-
171
-
172
-
173
-
174
-
175
-
176
-
177
-
178
-
179
-
180
-
181
-
182
-
183
-
184
-
185
-
186
-
187
-
188
-
189
-
190
-
191
-
192
-
193
-
194
-
195
-
196
-
197
-
198
-
199
-
200
-
201
-
202
-
203
-
204
-
205
-
206
-
207
-
208
-
209
-
210
-
211
-
212
-
213
-
214
-
215
-
216
-
217
-
218
-
219
-
220
-
221
-
222
-
223
-
224
 |
 |

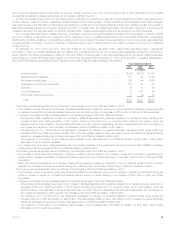
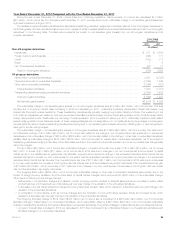
In determining the ranges, we have considered current market conditions, as well as the market level of spreads that can reasonably be anticipated
over the near term. The ranges do not reflect extreme market conditions experienced during the financial crisis as we do not consider those to be
reasonably likely events in the near future.
Changes in Balance Sheet
Carrying Value
At December 31, 2013
Policyholder
Account Balances DAC and
VOBA
(In millions)
100% increase in our credit spread ................................................... $(1,280) $(1,100)
As reported ..................................................................... $(1,040) $(1,099)
50% decrease in our credit spread ................................................... $ (909) $(1,098)
The accounting for derivatives is complex and interpretations of accounting standards continue to evolve in practice. If it is determined that hedge
accounting designations were not appropriately applied, reported net income could be materially affected. Assessments of hedge effectiveness and
measurements of ineffectiveness of hedging relationships are also subject to interpretations and estimations and different interpretations or estimates
may have a material effect on the amount reported in net income.
Variable annuities with guaranteed minimum benefits may be more costly than expected in volatile or declining equity markets. Market conditions
including, but not limited to, changes in interest rates, equity indices, market volatility and foreign currency exchange rates, changes in our
nonperformance risk, variations in actuarial assumptions regarding policyholder behavior, mortality and risk margins related to non-capital market inputs,
may result in significant fluctuations in the estimated fair value of the guarantees that could materially affect net income. If interpretations change, there is
a risk that features previously not bifurcated may require bifurcation and reporting at estimated fair value in the consolidated financial statements and
respective changes in estimated fair value could materially affect net income.
Additionally, we ceded the risk associated with certain of the variable annuities with guaranteed minimum benefits described in the preceding
paragraphs. The value of the embedded derivatives on the ceded risk is determined using a methodology consistent with that described previously for
the guarantees directly written by us with the exception of the input for nonperformance risk that reflects the credit of the reinsurer. Because certain of
the direct guarantees do not meet the definition of an embedded derivative and, thus are not accounted for at fair value, significant fluctuations in net
income may occur since the change in fair value of the embedded derivative on the ceded risk is being recorded in net income without a corresponding
and offsetting change in fair value of the direct guarantee.
See Note 9 of the Notes to the Consolidated Financial Statements for additional information on our derivatives and hedging programs.
Goodwill
Goodwill is tested for impairment at least annually or more frequently if events or circumstances, such as adverse changes in the business climate,
indicate that there may be justification for conducting an interim test.
For purposes of goodwill impairment testing, if the carrying value of a reporting unit exceeds its estimated fair value, the implied fair value of the
reporting unit goodwill is compared to the carrying value of that goodwill to measure the amount of impairment loss, if any. In such instances, the implied
fair value of the goodwill is determined in the same manner as the amount of goodwill that would be determined in a business acquisition. The key
inputs, judgments and assumptions necessary in determining estimated fair value of the reporting units include projected operating earnings, current
book value, the level of economic capital required to support the mix of business, long-term growth rates, comparative market multiples, the account
value of in-force business, projections of new and renewal business, as well as margins on such business, the level of interest rates, credit spreads,
equity market levels, and the discount rate that we believe is appropriate for the respective reporting unit. In performing the Company’s goodwill
impairment tests, the estimated fair values of the reporting units are first determined using a market multiple valuation approach. When further
corroboration is required, the Company uses a discounted cash flow valuation approach. For reporting units which are particularly sensitive to market
assumptions, the Company may use additional valuation methodologies to estimate the reporting units’ fair values.
In June 2013, the government of Poland announced proposals to the country’s pension system that, if adopted, would have negatively impacted
future operating earnings related to our pension business in Poland. We determined that this announcement was an event requiring an interim test of
goodwill impairment for the EMEA reporting unit during the quarter ended June 30, 2013. We performed this interim test principally using a market
multiple valuation approach. Results indicated that the fair value of the EMEA reporting unit exceeded its carrying value and, therefore, such goodwill
was not impaired.
During the 2013 annual goodwill impairment tests, we concluded that the fair values of all reporting units were in excess of their carrying values and,
therefore, goodwill was not impaired.
In 2012, we performed the annual goodwill impairment test on our Retail Annuities reporting unit using both the market multiple and discounted cash
flow valuation approaches. Results for both approaches indicated that the fair value of the Retail Annuities reporting unit was below its carrying value. As
a result, an actuarial appraisal, which estimates the net worth of the reporting unit, the value of existing business and the value of new business, was
performed. This appraisal resulted in a fair value of the Retail Annuities reporting unit that was less than the carrying value, indicating a potential for
goodwill impairment. The actuarial appraisal reflected the expected market impact to a buyer of changes in the regulatory environment, continued low
interest rates for an extended period of time, and other market and economic factors. Specifically, in July 2012, the Department of Financial Services
had initiated an inquiry into the use of captive or off-shore reinsurers, strategies many market participants have used for capital efficiency on variable
annuity products; the National Association of Insurance Commissioners (“NAIC”) had also been studying the use of captives. Within the Retail Annuities
reporting unit, most variable annuity guaranteed minimum benefit rider risk has historically been reinsured within a wholly-owned captive reinsurance
subsidiary. As permitted, we calculate regulatory capital for that entity using less conservative assumptions than would be required to calculate minimum
capital for this business by the ceding domestic insurance subsidiary. In prior period goodwill impairment analyses, management’s assessment was that
a buyer would base its appraisal on the assumption that it would be able to continue to maintain these reinsurance agreements indefinitely. In 2012, as
captive reinsurers came under increased regulatory scrutiny, we believed that a buyer would no longer take the view that replicating such a regulatory
capital structure using captives would be viable indefinitely and, therefore, would require a higher capital charge for the Retail Annuities reporting unit. We
performed Step 2 of the goodwill impairment process, which compares the implied fair value of the reporting unit’s goodwill with its carrying value. This
analysis indicated that the recorded goodwill associated with this reporting unit was not recoverable. Therefore, we recorded a non-cash charge of $1.9
billion ($1.6 billion, net of income tax) for the impairment of the entire goodwill balance that is reported in goodwill impairment in the consolidated
MetLife, Inc. 17