MetLife 2013 Annual Report Download - page 199
Download and view the complete annual report
Please find page 199 of the 2013 MetLife annual report below. You can navigate through the pages in the report by either clicking on the pages listed below, or by using the keyword search tool below to find specific information within the annual report.-
 1
1 -
2
-
3
-
4
-
5
-
6
-
7
-
8
-
9
-
10
-
11
-
12
-
13
-
14
-
15
-
16
-
17
-
18
-
19
-
20
-
21
-
22
-
23
-
24
-
25
-
26
-
27
-
28
-
29
-
30
-
31
-
32
-
33
-
34
-
35
-
36
-
37
-
38
-
39
-
40
-
41
-
42
-
43
-
44
-
45
-
46
-
47
-
48
-
49
-
50
-
51
-
52
-
53
-
54
-
55
-
56
-
57
-
58
-
59
-
60
-
61
-
62
-
63
-
64
-
65
-
66
-
67
-
68
-
69
-
70
-
71
-
72
-
73
-
74
-
75
-
76
-
77
-
78
-
79
-
80
-
81
-
82
-
83
-
84
-
85
-
86
-
87
-
88
-
89
-
90
-
91
-
92
-
93
-
94
-
95
-
96
-
97
-
98
-
99
-
100
-
101
-
102
-
103
-
104
-
105
-
106
-
107
-
108
-
109
-
110
-
111
-
112
-
113
-
114
-
115
-
116
-
117
-
118
-
119
-
120
-
121
-
122
-
123
-
124
-
125
-
126
-
127
-
128
-
129
-
130
-
131
-
132
-
133
-
134
-
135
-
136
-
137
-
138
-
139
-
140
-
141
-
142
-
143
-
144
-
145
-
146
-
147
-
148
-
149
-
150
-
151
-
152
-
153
-
154
-
155
-
156
-
157
-
158
-
159
-
160
-
161
-
162
-
163
-
164
-
165
-
166
-
167
-
168
-
169
-
170
-
171
-
172
-
173
-
174
-
175
-
176
-
177
-
178
-
179
-
180
-
181
-
182
-
183
-
184
-
185
-
186
-
187
-
188
-
 189
189 -
 190
190 -
 191
191 -
 192
192 -
 193
193 -
 194
194 -
 195
195 -
 196
196 -
 197
197 -
 198
198 -
 199
199 -
 200
200 -
 201
201 -
 202
202 -
 203
203 -
 204
204 -
 205
205 -
 206
206 -
 207
207 -
 208
208 -
 209
209 -
210
-
211
-
212
-
213
-
214
-
215
-
216
-
217
-
218
-
219
-
220
-
221
-
222
-
223
-
224
 |
 |

MetLife, Inc.
Notes to the Consolidated Financial Statements — (Continued)
18. Employee Benefit Plans (continued)
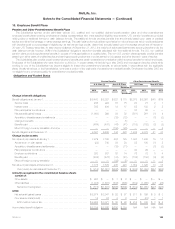
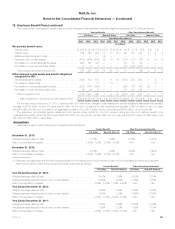
The components of net periodic benefit costs and other changes in plan assets and benefit obligations recognized in OCI were as follows:
Pension Benefits Other Postretirement Benefits
U.S. Plans Non-U.S. Plans U.S. Plans Non-U.S. Plans
Years Ended December 31,
2013 2012 2011 2013 2012 2011 2013 2012 2011 2013 2012 2011
(In millions)
Net periodic benefit costs:
Service costs ...................................... $ 236 $ 224 $ 187 $ 67 $ 75 $ 64 $ 20 $ 21 $ 16 $ 2 $ 1 $ 1
Interest costs ...................................... 389 406 404 14 17 16 92 103 106 2 2 2
Settlement and curtailment costs ....................... — — — (2) — — — — — 1 1 1
Expected return on plan assets ........................ (483) (484) (448) (6) (6) (6) (75) (77) (76) (1) (1) (1)
Amortization of net actuarial (gains) losses ................ 228 195 194 — — — 55 57 43 — — —
Amortization of prior service costs (credit) ................. 6 6 4 — — — (75) (104) (108) — — —
Total net periodic benefit costs (credit) ................. 376 347 341 73 86 74 17 — (19) 4 3 3
Other changes in plan assets and benefit obligations
recognized in OCI:
Net actuarial (gains) losses ............................ (545) 744 575 1 18 34 (533) 234 262 1 2 5
Prior service costs (credit) ............................. — — 17 — (1) — — — — — (1) —
Amortization of net actuarial gains (losses) ................ (228) (195) (194) — — — (55) (57) (43) (2) — —
Amortization of prior service (costs) credit ................. (6) (6) (4) — — — 75 104 108 — — —
Total recognized in OCI ............................. (779) 543 394 1 17 34 (513) 281 327 (1) 1 5
Total recognized in net periodic benefit costs and OCI . . . $ (403)$ 890 $ 735 $ 74 $ 103 $108 $ (496) $ 281 $ 308 $ 3 $ 4 $ 8
For the year ended December 31, 2013, included within OCI were other changes in plan assets and benefit obligations associated with pension
benefits of ($779) million for the U.S. plans and $1 million for the non-U.S. plans and other postretirement benefits of ($513) million for the U.S. plans
and ($1) million for the non-U.S. plans for an aggregate increase in OCI of $1.3 billion before income tax and $838 million, net of income tax.
The estimated net actuarial (gains) losses and prior service costs (credit) for the U.S. pension plans and the U.S. defined benefit other
postretirement benefit plans that will be amortized from AOCI into net periodic benefit costs over the next year are $151 million and $5 million, and
$6 million and ($1) million, respectively.
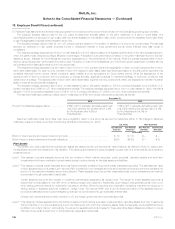
Assumptions
Assumptions used in determining benefit obligations were as follows:
Pension Benefits Other Postretirement Benefits
U.S. Plans Non-U.S. Plans (1) U.S. Plans Non-U.S. Plans (1)
December 31, 2013:
Weighted average discount rate ............................... 5.15% 1.94% 5.15% 6.47%
Rate of compensation increase ............................... 3.50% - 7.50% 2.00% - 5.50% N/A N/A
December 31, 2012:
Weighted average discount rate ............................... 4.20% 1.98% 4.20% 4.94%
Rate of compensation increase ............................... 3.50% - 7.50% 2.01% - 5.50% N/A N/A
(1) Reflects those assumptions that were most appropriate for the local economic environments of each of the Subsidiaries providing such benefits.
Assumptions used in determining net periodic benefit costs were as follows:
Pension Benefits Other Postretirement Benefits
U.S. Plans Non-U.S. Plans (1) U.S. Plans Non-U.S. Plans (1)
Year Ended December 31, 2013:
Weighted average discount rate ....................................... 4.20% 1.98% 4.20% 5.01%
Weighted average expected rate of return on plan assets ................... 6.25% 2.07% 5.76% 7.25%
Rate of compensation increase ....................................... 3.50% - 7.50% 1.50% - 5.50% N/A N/A
Year Ended December 31, 2012:
Weighted average discount rate ....................................... 4.95% 2.35% 4.95% 5.78%
Weighted average expected rate of return on plan assets ................... 7.00% 3.35% 6.26% 6.54%
Rate of compensation increase ....................................... 3.50% - 7.50% 2.00% - 4.00% N/A N/A
Year Ended December 31, 2011:
Weighted average discount rate ....................................... 5.80% 2.40% 5.80% 6.34%
Weighted average expected rate of return on plan assets ................... 7.25% 3.19% 7.25% 7.01%
Rate of compensation increase ....................................... 3.50% - 7.50% 3.00% - 5.50% N/A N/A
MetLife, Inc. 191