MetLife 2013 Annual Report Download - page 60
Download and view the complete annual report
Please find page 60 of the 2013 MetLife annual report below. You can navigate through the pages in the report by either clicking on the pages listed below, or by using the keyword search tool below to find specific information within the annual report.-
 1
1 -
2
-
3
-
4
-
5
-
6
-
7
-
8
-
9
-
10
-
11
-
12
-
13
-
14
-
15
-
16
-
17
-
18
-
19
-
20
-
21
-
22
-
23
-
24
-
25
-
26
-
27
-
28
-
29
-
30
-
31
-
32
-
33
-
34
-
35
-
36
-
37
-
38
-
39
-
40
-
41
-
42
-
43
-
44
-
45
-
46
-
47
-
48
-
49
-
 50
50 -
 51
51 -
 52
52 -
 53
53 -
 54
54 -
 55
55 -
 56
56 -
 57
57 -
 58
58 -
 59
59 -
 60
60 -
 61
61 -
 62
62 -
 63
63 -
 64
64 -
 65
65 -
 66
66 -
 67
67 -
 68
68 -
 69
69 -
 70
70 -
71
-
72
-
73
-
74
-
75
-
76
-
77
-
78
-
79
-
80
-
81
-
82
-
83
-
84
-
85
-
86
-
87
-
88
-
89
-
90
-
91
-
92
-
93
-
94
-
95
-
96
-
97
-
98
-
99
-
100
-
101
-
102
-
103
-
104
-
105
-
106
-
107
-
108
-
109
-
110
-
111
-
112
-
113
-
114
-
115
-
116
-
117
-
118
-
119
-
120
-
121
-
122
-
123
-
124
-
125
-
126
-
127
-
128
-
129
-
130
-
131
-
132
-
133
-
134
-
135
-
136
-
137
-
138
-
139
-
140
-
141
-
142
-
143
-
144
-
145
-
146
-
147
-
148
-
149
-
150
-
151
-
152
-
153
-
154
-
155
-
156
-
157
-
158
-
159
-
160
-
161
-
162
-
163
-
164
-
165
-
166
-
167
-
168
-
169
-
170
-
171
-
172
-
173
-
174
-
175
-
176
-
177
-
178
-
179
-
180
-
181
-
182
-
183
-
184
-
185
-
186
-
187
-
188
-
189
-
190
-
191
-
192
-
193
-
194
-
195
-
196
-
197
-
198
-
199
-
200
-
201
-
202
-
203
-
204
-
205
-
206
-
207
-
208
-
209
-
210
-
211
-
212
-
213
-
214
-
215
-
216
-
217
-
218
-
219
-
220
-
221
-
222
-
223
-
224
 |
 |

‰The statement of operations effects of derivatives in cash flow, fair value, or non-qualifying hedge relationships for the years ended December 31,
2013 and 2012.
See “Quantitative and Qualitative Disclosures About Market Risk — Management of Market Risk Exposures — Hedging Activities” for more
information about our use of derivatives by major hedge program.
Fair Value Hierarchy
See Note 10 of the Notes to the Consolidated Financial Statements for derivatives measured at estimated fair value on a recurring basis and their
corresponding fair value hierarchy.
The valuation of Level 3 derivatives involves the use of significant unobservable inputs and generally requires a higher degree of management judgment
or estimation than the valuations of Level 1 and Level 2 derivatives. Although Level 3 inputs are unobservable, management believes they are consistent
with what other market participants would use when pricing such instruments and are considered appropriate given the circumstances. The use of
different inputs or methodologies could have a material effect on the estimated fair value of Level 3 derivatives and could materially affect net income.
Derivatives categorized as Level 3 at December 31, 2013 include: interest rate swaps and interest rate forwards with maturities which extend
beyond the observable portion of the yield curve; cancellable foreign currency swaps with unobservable currency correlation inputs; foreign currency
swaps and forwards with certain unobservable inputs, including unobservable portion of the yield curve; credit default swaps priced using unobservable
credit spreads, or that are priced through independent broker quotations; equity variance swaps with unobservable volatility inputs; and equity options
with unobservable correlation inputs. At both December 31, 2013 and 2012, less than 1% of the net derivative estimated fair value was priced through
independent broker quotations.
See Note 10 of the Notes to the Consolidated Financial Statements for a rollforward of the fair value measurements for derivatives measured at
estimated fair value on a recurring basis using significant unobservable (Level 3) inputs.
Level 3 derivatives had a ($537) million gain (loss) recognized in net income (loss) for the year ended December 31, 2013. This loss primarily relates
to certain purchased equity options that are valued using models dependent on an unobservable market correlation input and equity variance swaps
that are valued using observable equity volatility data plus an unobservable equity variance spread. The unobservable equity variance spread is
calculated from a comparison between broker offered variance swap volatility and observable equity option volatility. Other significant inputs, which are
observable, include equity index levels, equity volatility and the swap yield curve. We validate the reasonableness of these inputs by valuing the
positions using internal models and comparing the results to broker quotations. The primary drivers of the loss during the year ended December 31,
2013 were increases in interest rates, increases in equity index levels and decreases in equity volatility, which in total accounted for approximately 63%
of the loss. Changes in the unobservable inputs accounted for approximately 37% of the loss.
See “Summary of Critical Accounting Estimates — Derivatives” for further information on the estimates and assumptions that affect derivatives.
Credit Risk
See Note 9 of the Notes to the Consolidated Financial Statements for information about how we manage credit risk related to derivatives and for the
estimated fair value of our net derivative assets and net derivative liabilities after the application of master netting agreements and collateral.
Our policy is not to offset the fair value amounts recognized for derivatives executed with the same counterparty under the same master netting
agreement. This policy applies to the recognition of derivatives in the consolidated balance sheets, and does not affect our legal right of offset.
Credit Derivatives
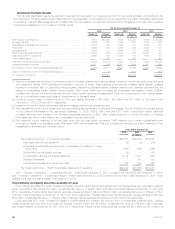
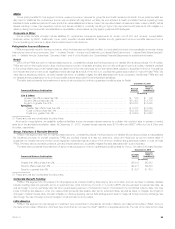
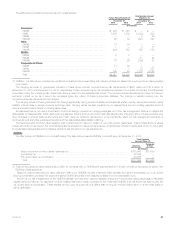
The following table presents the gross notional amount and estimated fair value of credit default swaps at:
December 31, 2013 December 31, 2012
Credit Default Swaps Notional
Amount Estimated
Fair Value Notional
Amount Estimated
Fair Value
(In millions)
Purchased (1) ....................................................................... $ 3,725 $ (44) $ 3,674 $(23)
Written (2) .......................................................................... 9,055 165 8,879 74
Total ............................................................................. $12,780 $121 $12,553 $ 51
(1) The notional amount and estimated fair value for purchased credit default swaps in the trading portfolio were $355 million and ($10) million,
respectively, at December 31, 2013 and $380 million and ($1) million, respectively, at December 31, 2012.
(2) The notional amount and estimated fair value for written credit default swaps in the trading portfolio were $10 million and $0, respectively, at both
December 31, 2013 and 2012.
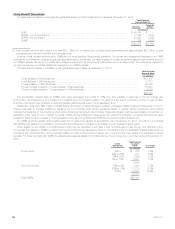
The following table presents the gross gains, gross losses and net gain (losses) recognized in income for credit default swaps as follows:
Years Ended December 31,
2013 2012
Credit Default Swaps Gross
Gains (1) Gross
Losses (1)
Net
Gains
(Losses) Gross
Gains (1) Gross
Losses (1)
Net
Gains
(Losses)
(In millions)
Purchased (2), (4) ...................................................... $ 13 $(48) $ (35) $ 9 $(321) $(312)
Written (3), (4) ......................................................... 157 (26) 131 158 (8) 150
Total ............................................................... $170 $(74) $ 96 $167 $(329) $(162)
(1) Gains (losses) are reported in net derivative gains (losses), except for gains (losses) on the trading portfolio, which are reported in net investment
income.
(2) The gross gains and gross (losses) for purchased credit default swaps in the trading portfolio were $2 million and ($16) million, respectively, for the
year ended December 31, 2013 and $7 million and ($21) million, respectively, for the year ended December 31, 2012.
(3) The gross gains and gross (losses) for written credit default swaps in the trading portfolio were $1 million and $0, respectively, for the year ended
December 31, 2013. The gross gains and gross (losses) for written credit default swaps in the trading portfolio were not significant for the year
ended December 31, 2012.
52 MetLife, Inc.