MetLife 2013 Annual Report Download - page 156
Download and view the complete annual report
Please find page 156 of the 2013 MetLife annual report below. You can navigate through the pages in the report by either clicking on the pages listed below, or by using the keyword search tool below to find specific information within the annual report.-
 1
1 -
2
-
3
-
4
-
5
-
6
-
7
-
8
-
9
-
10
-
11
-
12
-
13
-
14
-
15
-
16
-
17
-
18
-
19
-
20
-
21
-
22
-
23
-
24
-
25
-
26
-
27
-
28
-
29
-
30
-
31
-
32
-
33
-
34
-
35
-
36
-
37
-
38
-
39
-
40
-
41
-
42
-
43
-
44
-
45
-
46
-
47
-
48
-
49
-
50
-
51
-
52
-
53
-
54
-
55
-
56
-
57
-
58
-
59
-
60
-
61
-
62
-
63
-
64
-
65
-
66
-
67
-
68
-
69
-
70
-
71
-
72
-
73
-
74
-
75
-
76
-
77
-
78
-
79
-
80
-
81
-
82
-
83
-
84
-
85
-
86
-
87
-
88
-
89
-
90
-
91
-
92
-
93
-
94
-
95
-
96
-
97
-
98
-
99
-
100
-
101
-
102
-
103
-
104
-
105
-
106
-
107
-
108
-
109
-
110
-
111
-
112
-
113
-
114
-
115
-
116
-
117
-
118
-
119
-
120
-
121
-
122
-
123
-
124
-
125
-
126
-
127
-
128
-
129
-
130
-
131
-
132
-
133
-
134
-
135
-
136
-
137
-
138
-
139
-
140
-
141
-
142
-
143
-
144
-
145
-
 146
146 -
 147
147 -
 148
148 -
 149
149 -
 150
150 -
 151
151 -
 152
152 -
 153
153 -
 154
154 -
 155
155 -
 156
156 -
 157
157 -
 158
158 -
 159
159 -
 160
160 -
 161
161 -
 162
162 -
 163
163 -
 164
164 -
 165
165 -
 166
166 -
167
-
168
-
169
-
170
-
171
-
172
-
173
-
174
-
175
-
176
-
177
-
178
-
179
-
180
-
181
-
182
-
183
-
184
-
185
-
186
-
187
-
188
-
189
-
190
-
191
-
192
-
193
-
194
-
195
-
196
-
197
-
198
-
199
-
200
-
201
-
202
-
203
-
204
-
205
-
206
-
207
-
208
-
209
-
210
-
211
-
212
-
213
-
214
-
215
-
216
-
217
-
218
-
219
-
220
-
221
-
222
-
223
-
224
 |
 |

MetLife, Inc.
Notes to the Consolidated Financial Statements — (Continued)
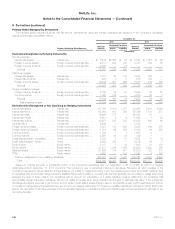
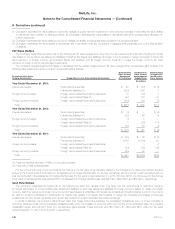
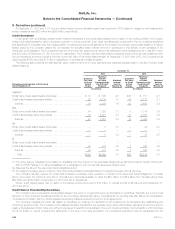
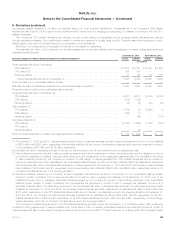
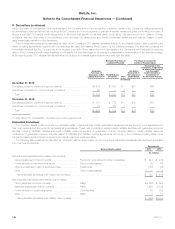
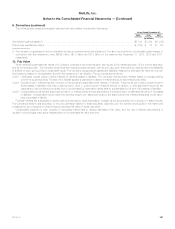
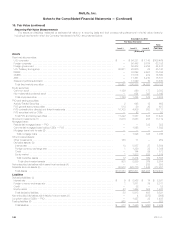
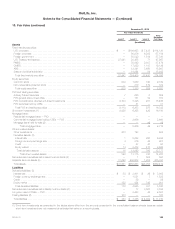
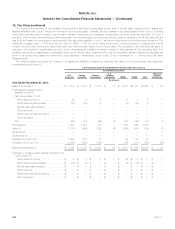
10. Fair Value (continued)
Recurring Fair Value Measurements
The assets and liabilities measured at estimated fair value on a recurring basis and their corresponding placement in the fair value hierarchy,
including those items for which the Company has elected the FVO, are presented below.
December 31, 2013
Fair Value Hierarchy
Level 1 Level 2 Level 3
Total
Estimated
Fair Value
(In millions)
Assets
Fixed maturity securities:
U.S. corporate .................................................................. $ — $ 99,321 $ 7,148 $106,469
Foreign corporate ................................................................ — 56,448 6,704 63,152
Foreign government .............................................................. — 52,202 2,235 54,437
U.S. Treasury and agency ......................................................... 25,061 20,000 62 45,123
RMBS ......................................................................... — 32,098 2,957 35,055
CMBS ......................................................................... — 15,578 972 16,550
ABS........................................................................... — 11,361 4,210 15,571
State and political subdivision ....................................................... — 13,820 10 13,830
Total fixed maturity securities ...................................................... 25,061 300,828 24,298 350,187
Equity securities:
Common stock .................................................................. 1,186 990 177 2,353
Non-redeemable preferred stock .................................................... — 654 395 1,049
Total equity securities ............................................................ 1,186 1,644 572 3,402
FVO and trading securities:
Actively Traded Securities .......................................................... 2 648 12 662
FVO general account securities ..................................................... 518 80 29 627
FVO contractholder-directed unit-linked investments ..................................... 10,702 4,806 603 16,111
FVO securities held by CSEs ....................................................... — 23 — 23
Total FVO and trading securities .................................................... 11,222 5,557 644 17,423
Short-term investments (1) .......................................................... 5,915 6,943 254 13,112
Mortgage loans:
Residential mortgage loans — FVO .................................................. — — 338 338
Commercial mortgage loans held by CSEs — FVO ...................................... — 1,598 — 1,598
Mortgage loans held-for-sale (2) ..................................................... — — — —
Total mortgage loans ........................................................... — 1,598 338 1,936
Other invested assets:
Other investments ................................................................ 188 71 — 259
Derivative assets: (3)
Interest rate .................................................................... 10 5,557 27 5,594
Foreign currency exchange rate .................................................... 1 1,280 28 1,309
Credit ........................................................................ — 144 29 173
Equity market .................................................................. 1 1,233 285 1,519
Total derivative assets ........................................................... 12 8,214 369 8,595
Total other invested assets ..................................................... 200 8,285 369 8,854
Net embedded derivatives within asset host contracts (4) .................................. — — 285 285
Separate account assets (5) ......................................................... 89,960 225,776 1,465 317,201
Total assets ................................................................... $133,544 $550,631 $28,225 $712,400
Liabilities
Derivative liabilities: (3)
Interest rate ..................................................................... $ 9 $ 2,568 $ 14 $ 2,591
Foreign currency exchange rate ..................................................... 1 1,971 39 2,011
Credit ......................................................................... — 52 — 52
Equity market ................................................................... 43 1,222 602 1,867
Total derivative liabilities .......................................................... 53 5,813 655 6,521
Net embedded derivatives within liability host contracts (4) .................................. — 4 (973) (969)
Long-term debt of CSEs — FVO ...................................................... — 1,427 28 1,455
Trading liabilities (6) ................................................................ 260 2 — 262
Total liabilities .................................................................. $ 313 $ 7,246 $ (290) $ 7,269
148 MetLife, Inc.