MetLife 2013 Annual Report Download - page 112
Download and view the complete annual report
Please find page 112 of the 2013 MetLife annual report below. You can navigate through the pages in the report by either clicking on the pages listed below, or by using the keyword search tool below to find specific information within the annual report.-
 1
1 -
2
-
3
-
4
-
5
-
6
-
7
-
8
-
9
-
10
-
11
-
12
-
13
-
14
-
15
-
16
-
17
-
18
-
19
-
20
-
21
-
22
-
23
-
24
-
25
-
26
-
27
-
28
-
29
-
30
-
31
-
32
-
33
-
34
-
35
-
36
-
37
-
38
-
39
-
40
-
41
-
42
-
43
-
44
-
45
-
46
-
47
-
48
-
49
-
50
-
51
-
52
-
53
-
54
-
55
-
56
-
57
-
58
-
59
-
60
-
61
-
62
-
63
-
64
-
65
-
66
-
67
-
68
-
69
-
70
-
71
-
72
-
73
-
74
-
75
-
76
-
77
-
78
-
79
-
80
-
81
-
82
-
83
-
84
-
85
-
86
-
87
-
88
-
89
-
90
-
91
-
92
-
93
-
94
-
95
-
96
-
97
-
98
-
99
-
100
-
101
-
 102
102 -
 103
103 -
 104
104 -
 105
105 -
 106
106 -
 107
107 -
 108
108 -
 109
109 -
 110
110 -
 111
111 -
 112
112 -
 113
113 -
 114
114 -
 115
115 -
 116
116 -
 117
117 -
 118
118 -
 119
119 -
 120
120 -
 121
121 -
 122
122 -
123
-
124
-
125
-
126
-
127
-
128
-
129
-
130
-
131
-
132
-
133
-
134
-
135
-
136
-
137
-
138
-
139
-
140
-
141
-
142
-
143
-
144
-
145
-
146
-
147
-
148
-
149
-
150
-
151
-
152
-
153
-
154
-
155
-
156
-
157
-
158
-
159
-
160
-
161
-
162
-
163
-
164
-
165
-
166
-
167
-
168
-
169
-
170
-
171
-
172
-
173
-
174
-
175
-
176
-
177
-
178
-
179
-
180
-
181
-
182
-
183
-
184
-
185
-
186
-
187
-
188
-
189
-
190
-
191
-
192
-
193
-
194
-
195
-
196
-
197
-
198
-
199
-
200
-
201
-
202
-
203
-
204
-
205
-
206
-
207
-
208
-
209
-
210
-
211
-
212
-
213
-
214
-
215
-
216
-
217
-
218
-
219
-
220
-
221
-
222
-
223
-
224
 |
 |

MetLife, Inc.
Notes to the Consolidated Financial Statements — (Continued)
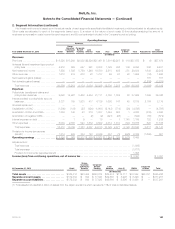
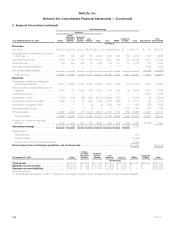
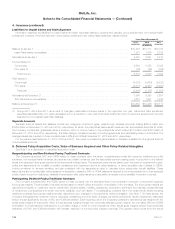
2. Segment Information (continued)
Operating Earnings
Americas
Year Ended December 31, 2012 Retail
Group,
Voluntary
& Worksite
Benefits
Corporate
Benefit
Funding Latin
America Total Asia EMEA Corporate
& Other Total Adjustments Total
Consolidated
(In millions)
Revenues
Premiums .......................... $ 6,532 $14,794 $3,237 $2,578 $27,141 $ 8,344 $2,370 $ 56 $37,911 $ 64 $37,975
Universal life and investment-type product
policy fees ....................... 4,561 662 225 785 6,233 1,491 333 155 8,212 344 8,556
Net investment income ............... 7,670 1,768 5,703 1,198 16,339 2,895 535 703 20,472 1,512 21,984
Other revenues ..................... 879 422 259 16 1,576 26 121 33 1,756 150 1,906
Net investment gains (losses) ........... — — — — — — — — — (352) (352)
Net derivative gains (losses) ............ — — — — — — — — — (1,919) (1,919)
Total revenues .................... 19,642 17,646 9,424 4,577 51,289 12,756 3,359 947 68,351 (201) 68,150
Expenses
Policyholder benefits and claims and
policyholder dividends .............. 9,010 13,691 5,704 2,231 30,636 5,819 1,196 119 37,770 1,586 39,356
Interest credited to policyholder account
balances ......................... 2,375 167 1,358 393 4,293 1,784 126 39 6,242 1,487 7,729
Goodwill impairment .................. — — — — — — — — — 1,868 1,868
Capitalization of DAC ................. (1,753) (138) (29) (353) (2,273) (2,288) (723) — (5,284) (5) (5,289)
Amortization of DAC and VOBA ......... 1,607 133 22 224 1,986 1,563 626 2 4,177 22 4,199
Amortization of negative VOBA .......... — — — (5) (5) (456) (94) — (555) (67) (622)
Interest expense on debt .............. — 1 8 (1) 8 5 1 1,176 1,190 166 1,356
Other expenses ..................... 5,369 2,351 478 1,375 9,573 4,738 1,810 559 16,680 1,431 18,111
Total expenses .................... 16,608 16,205 7,541 3,864 44,218 11,165 2,942 1,895 60,220 6,488 66,708
Provision for income tax expense
(benefit) ......................... 1,032 481 659 130 2,302 554 146 (679) 2,323 (2,195) 128
Operating earnings ................ $ 2,002 $ 960 $1,224 $ 583 $ 4,769 $ 1,037 $ 271 $ (269) 5,808
Adjustments to:
Total revenues ............................................................................... (201)
Total expenses ............................................................................... (6,488)
Provision for income tax (expense) benefit .......................................................... 2,195
Income (loss) from continuing operations, net of income tax ....................................... $ 1,314 $ 1,314
At December 31, 2012 Retail
Group,
Voluntary
& Worksite
Benefits
Corporate
Benefit
Funding Latin
America Asia (1) EMEA Corporate
& Other Total
(In millions)
Total assets .............................. $332,387 $44,138 $217,352 $23,272 $131,138 $23,474 $65,020 $836,781
Separate account assets .................. $150,513 $ 532 $ 71,875 $ 4,200 $ 8,273 $ — $ — $235,393
Separate account liabilities ................ $150,513 $ 532 $ 71,875 $ 4,200 $ 8,273 $ — $ — $235,393
(1) Total assets includes $111.0 billion of assets from the Japan operations which represents 13% of total consolidated assets.
104 MetLife, Inc.