MetLife 2013 Annual Report Download - page 85
Download and view the complete annual report
Please find page 85 of the 2013 MetLife annual report below. You can navigate through the pages in the report by either clicking on the pages listed below, or by using the keyword search tool below to find specific information within the annual report.-
 1
1 -
2
-
3
-
4
-
5
-
6
-
7
-
8
-
9
-
10
-
11
-
12
-
13
-
14
-
15
-
16
-
17
-
18
-
19
-
20
-
21
-
22
-
23
-
24
-
25
-
26
-
27
-
28
-
29
-
30
-
31
-
32
-
33
-
34
-
35
-
36
-
37
-
38
-
39
-
40
-
41
-
42
-
43
-
44
-
45
-
46
-
47
-
48
-
49
-
50
-
51
-
52
-
53
-
54
-
55
-
56
-
57
-
58
-
59
-
60
-
61
-
62
-
63
-
64
-
65
-
66
-
67
-
68
-
69
-
70
-
71
-
72
-
73
-
74
-
 75
75 -
 76
76 -
 77
77 -
 78
78 -
 79
79 -
 80
80 -
 81
81 -
 82
82 -
 83
83 -
 84
84 -
 85
85 -
 86
86 -
 87
87 -
 88
88 -
 89
89 -
 90
90 -
 91
91 -
 92
92 -
 93
93 -
 94
94 -
 95
95 -
96
-
97
-
98
-
99
-
100
-
101
-
102
-
103
-
104
-
105
-
106
-
107
-
108
-
109
-
110
-
111
-
112
-
113
-
114
-
115
-
116
-
117
-
118
-
119
-
120
-
121
-
122
-
123
-
124
-
125
-
126
-
127
-
128
-
129
-
130
-
131
-
132
-
133
-
134
-
135
-
136
-
137
-
138
-
139
-
140
-
141
-
142
-
143
-
144
-
145
-
146
-
147
-
148
-
149
-
150
-
151
-
152
-
153
-
154
-
155
-
156
-
157
-
158
-
159
-
160
-
161
-
162
-
163
-
164
-
165
-
166
-
167
-
168
-
169
-
170
-
171
-
172
-
173
-
174
-
175
-
176
-
177
-
178
-
179
-
180
-
181
-
182
-
183
-
184
-
185
-
186
-
187
-
188
-
189
-
190
-
191
-
192
-
193
-
194
-
195
-
196
-
197
-
198
-
199
-
200
-
201
-
202
-
203
-
204
-
205
-
206
-
207
-
208
-
209
-
210
-
211
-
212
-
213
-
214
-
215
-
216
-
217
-
218
-
219
-
220
-
221
-
222
-
223
-
224
 |
 |

included herein as any foreign currency exchange rate risk is borne by the contractholder. Mortgage loans, fair value option and trading securities
and long-term debt exclude $1.6 billion, $23 million and $1.5 billion, respectively, related to CSEs. See Note 8 of the Notes to Consolidated
Financial Statements for information regarding CSEs.
(2) Embedded derivatives are recognized in the consolidated balance sheet in the same caption as the host contract.
(3) Excludes $203.2 billion of liabilities, at carrying value, pursuant to insurance contracts reported within future policy benefits and other policy-related
balances. These liabilities would economically offset a significant portion of the net change in fair value of our financial instruments resulting from a
10% increase in foreign currency exchange rates.
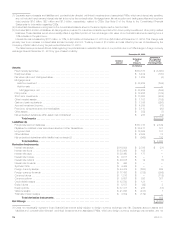
Foreign currency exchange rate risk decreased by $5 million during the year ended December 31, 2013. This change was primarily due to an
increase in exposure to the British Pound offset by a decrease in exposure to the Japanese Yen.
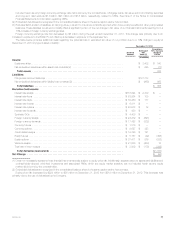
The table below provides additional detail regarding the potential loss in estimated fair value of our portfolio due to a 10% change in equity at
December 31, 2013 by type of asset or liability:
December 31, 2013
Notional
Amount
Estimated
Fair
Value (1)
Assuming a
10% Increase
in Equity
Prices
(In millions)
Assets:
Equity securities ......................................................................... $ 3,402 $ 340
Net embedded derivatives within asset host contracts (2) ........................................ $ 285 (17)
Total assets ........................................................................ 323
Liabilities:
Policyholder account balances ............................................................. $137,773 —
Net embedded derivatives within liability host contracts (2) ........................................ $ (969) 665
Total liabilities ...................................................................... $ 665
Derivative Instruments:
Interest rate swaps ...................................................................... $116,894 $ 2,709 $ —
Interest rate floors ....................................................................... $ 63,064 $ 105 —
Interest rate caps ........................................................................ $ 39,460 $ 177 —
Interest rate futures ...................................................................... $ 6,011 $ — —
Interest rate options ...................................................................... $ 40,978 $ 12 —
Interest rate forwards ..................................................................... $ 450 $ — —
Synthetic GICs ......................................................................... $ 4,409 $ — —
Foreign currency swaps .................................................................. $ 24,472 $ (693) —
Foreign currency forwards ................................................................. $ 17,428 $ (332) —
Currency futures ........................................................................ $ 1,316 $ — —
Currency options ........................................................................ $ 9,627 $ 323 —
Credit default swaps ..................................................................... $ 12,780 $ 121 —
Equity futures ........................................................................... $ 5,157 $ (42) (456)
Equity options .......................................................................... $ 37,411 $ 276 (238)
Variance swaps ......................................................................... $ 21,636 $ (403) 10
Total rate of return swaps ................................................................. $ 3,802 $ (179) (399)
Total derivative instruments .......................................................... $(1,083)
Net Change ............................................................................ $ (95)
(1) Does not necessarily represent those financial instruments solely subject to equity price risk. Additionally, separate account assets and liabilities and
contractholder-directed unit-linked investments and associated PABs, which are equity market sensitive, are not included herein as any equity
market risk is borne by the contractholder.
(2) Embedded derivatives are recognized in the consolidated balance sheet in the same caption as the host contract.
Equity price risk decreased by $224 million to $95 million at December 31, 2013 from $319 million at December 31, 2012. This decrease was
primarily due to the use of derivatives by the Company.
MetLife, Inc. 77