MetLife 2013 Annual Report Download - page 189
Download and view the complete annual report
Please find page 189 of the 2013 MetLife annual report below. You can navigate through the pages in the report by either clicking on the pages listed below, or by using the keyword search tool below to find specific information within the annual report.-
 1
1 -
2
-
3
-
4
-
5
-
6
-
7
-
8
-
9
-
10
-
11
-
12
-
13
-
14
-
15
-
16
-
17
-
18
-
19
-
20
-
21
-
22
-
23
-
24
-
25
-
26
-
27
-
28
-
29
-
30
-
31
-
32
-
33
-
34
-
35
-
36
-
37
-
38
-
39
-
40
-
41
-
42
-
43
-
44
-
45
-
46
-
47
-
48
-
49
-
50
-
51
-
52
-
53
-
54
-
55
-
56
-
57
-
58
-
59
-
60
-
61
-
62
-
63
-
64
-
65
-
66
-
67
-
68
-
69
-
70
-
71
-
72
-
73
-
74
-
75
-
76
-
77
-
78
-
79
-
80
-
81
-
82
-
83
-
84
-
85
-
86
-
87
-
88
-
89
-
90
-
91
-
92
-
93
-
94
-
95
-
96
-
97
-
98
-
99
-
100
-
101
-
102
-
103
-
104
-
105
-
106
-
107
-
108
-
109
-
110
-
111
-
112
-
113
-
114
-
115
-
116
-
117
-
118
-
119
-
120
-
121
-
122
-
123
-
124
-
125
-
126
-
127
-
128
-
129
-
130
-
131
-
132
-
133
-
134
-
135
-
136
-
137
-
138
-
139
-
140
-
141
-
142
-
143
-
144
-
145
-
146
-
147
-
148
-
149
-
150
-
151
-
152
-
153
-
154
-
155
-
156
-
157
-
158
-
159
-
160
-
161
-
162
-
163
-
164
-
165
-
166
-
167
-
168
-
169
-
170
-
171
-
172
-
173
-
174
-
175
-
176
-
177
-
178
-
 179
179 -
 180
180 -
 181
181 -
 182
182 -
 183
183 -
 184
184 -
 185
185 -
 186
186 -
 187
187 -
 188
188 -
 189
189 -
 190
190 -
 191
191 -
 192
192 -
 193
193 -
 194
194 -
 195
195 -
 196
196 -
 197
197 -
 198
198 -
 199
199 -
200
-
201
-
202
-
203
-
204
-
205
-
206
-
207
-
208
-
209
-
210
-
211
-
212
-
213
-
214
-
215
-
216
-
217
-
218
-
219
-
220
-
221
-
222
-
223
-
224
 |
 |

MetLife, Inc.
Notes to the Consolidated Financial Statements — (Continued)
16. Equity (continued)
The binomial lattice model used by the Company incorporates different risk-free rates based on the imputed forward rates for U.S. Treasury Strips
for each year over the contractual term of the option. The table below presents the full range of rates that were used for options granted during the
respective periods.
Dividend yield is determined based on historical dividend distributions compared to the price of the underlying Shares as of the valuation date and
held constant over the life of the Stock Option.
The binomial lattice model used by the Company incorporates the contractual term of the Stock Options. The model also factors in expected
exercise behavior and a post-vesting termination rate, or the rate at which vested options are exercised or expire prematurely due to termination of
employment. From these factors, the model derives an expected life of the Stock Option. The exercise behavior in the model is a multiple that reflects
the ratio of exercise price to the strike price of the Stock Option at which holders are expected to exercise. The exercise multiple is derived from
actual historical exercise activity. The post-vesting termination rate is determined from actual historical exercise experience and expiration activity
under the Incentive Plans.
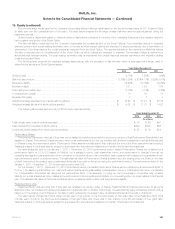
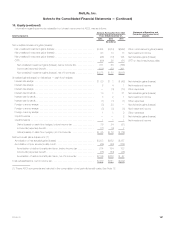
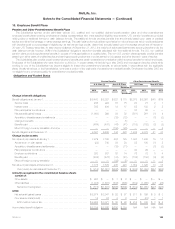
The following table presents the weighted average assumptions, with the exception of risk-free rate, which is expressed as a range, used to
determine the fair value of Stock Options issued:
Years Ended December 31,
2013 2012 2011
Dividend yield ...................................................................... 2.13% 1.95% 1.65%
Risk-free rate of return ............................................................... 0.16%-3.89% 0.21%-4.17% 0.29%-5.51%
Expected volatility ................................................................... 32.98% 35.59% 32.64%
Exercise multiple ................................................................... 1.51 1.58 1.69
Post-vesting termination rate .......................................................... 3.16% 3.14% 3.36%
Contractual term (years) .............................................................. 10 10 10
Expected life (years) ................................................................. 7 7 7
Weighted average exercise price of stock options granted ................................... $ 35.96 $ 37.91 $ 45.16
Weighted average fair value of stock options granted ....................................... $ 9.88 $ 11.33 $ 14.27
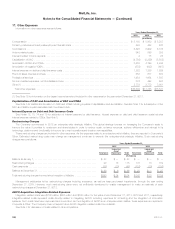
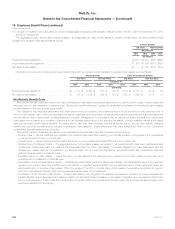
The following table presents a summary of Stock Option exercise activity:
Years Ended December 31,
2013 2012 2011
(In millions)
Total intrinsic value of stock options exercised ......................................................... $ 79 $ 29 $41
Cash received from exercise of stock options ......................................................... $202 $109 $88
Income tax benefit realized from stock options exercised ................................................. $ 28 $ 10 $14
Performance Shares
Performance Shares are units that, if they vest, are multiplied by a performance factor to produce a number of final Performance Shares which are
payable in Shares. Performance Shares are accounted for as equity awards, but are not credited with dividend-equivalents for actual dividends paid
on Shares during the performance period. Performance Share awards normally vest in their entirety at the end of the three-year performance period.
Vesting is subject to continued service, except for employees who are retirement eligible and in certain other limited circumstances.
For awards granted prior to the January 1, 2013 – December 31, 2015 performance period, vested Performance Shares are multiplied by a
performance factor of 0.0 to 2.0 based on MetLife, Inc.’s adjusted income, total shareholder return, and performance in change in annual net
operating earnings and total shareholder return compared to the performance of its competitors, each measured with respect to the applicable three-
year performance period or portions thereof. The estimated fair value of Performance Shares is based upon the closing price of a Share on the date
of grant, reduced by the present value of estimated dividends to be paid on that stock during the performance period. The performance factor for the
January 1, 2010 – December 31, 2012 performance period was 0.92.
For the January 1, 2013 – December 31, 2015 performance period, the vested Performance Shares will be multiplied by a performance factor of
0.00 to 1.75. Assuming that MetLife, Inc. has met threshold performance goals related to its adjusted income or total shareholder return, the MetLife,
Inc. Compensation Committee will determine the performance factor in its discretion. In doing so, the Compensation Committee may consider
MetLife, Inc.’s total shareholder return relative to the performance of its competitors and MetLife, Inc.’s operating return on equity relative to its financial
plan. The estimated fair value of Performance Shares will be remeasured each quarter until they become payable.
Restricted Stock Units
Restricted Stock Units are units that, if they vest, are payable in an equal number of Shares. Restricted Stock Units are accounted for as equity
awards and are not credited with dividend-equivalents for dividends paid on Shares. Accordingly, the estimated fair value of Restricted Stock Units is
based upon the closing price of Shares on the date of grant, reduced by the present value of estimated dividends to be paid on that stock.
The vast majority of Restricted Stock Units normally vest in their entirety on the third anniversary of their grant date. Other Restricted Stock Units
normally vest in thirds on the first three anniversaries of their grant date, and others vest in their entirety on the fifth anniversary of their grant date.
Vesting is subject to continued service, except for employees who are retirement eligible and in certain other limited circumstances.
MetLife, Inc. 181