MetLife 2013 Annual Report Download - page 28
Download and view the complete annual report
Please find page 28 of the 2013 MetLife annual report below. You can navigate through the pages in the report by either clicking on the pages listed below, or by using the keyword search tool below to find specific information within the annual report.-
 1
1 -
2
-
3
-
4
-
5
-
6
-
7
-
8
-
9
-
10
-
11
-
12
-
13
-
14
-
15
-
16
-
17
-
 18
18 -
 19
19 -
 20
20 -
 21
21 -
 22
22 -
 23
23 -
 24
24 -
 25
25 -
 26
26 -
 27
27 -
 28
28 -
 29
29 -
 30
30 -
 31
31 -
 32
32 -
 33
33 -
 34
34 -
 35
35 -
 36
36 -
 37
37 -
 38
38 -
39
-
40
-
41
-
42
-
43
-
44
-
45
-
46
-
47
-
48
-
49
-
50
-
51
-
52
-
53
-
54
-
55
-
56
-
57
-
58
-
59
-
60
-
61
-
62
-
63
-
64
-
65
-
66
-
67
-
68
-
69
-
70
-
71
-
72
-
73
-
74
-
75
-
76
-
77
-
78
-
79
-
80
-
81
-
82
-
83
-
84
-
85
-
86
-
87
-
88
-
89
-
90
-
91
-
92
-
93
-
94
-
95
-
96
-
97
-
98
-
99
-
100
-
101
-
102
-
103
-
104
-
105
-
106
-
107
-
108
-
109
-
110
-
111
-
112
-
113
-
114
-
115
-
116
-
117
-
118
-
119
-
120
-
121
-
122
-
123
-
124
-
125
-
126
-
127
-
128
-
129
-
130
-
131
-
132
-
133
-
134
-
135
-
136
-
137
-
138
-
139
-
140
-
141
-
142
-
143
-
144
-
145
-
146
-
147
-
148
-
149
-
150
-
151
-
152
-
153
-
154
-
155
-
156
-
157
-
158
-
159
-
160
-
161
-
162
-
163
-
164
-
165
-
166
-
167
-
168
-
169
-
170
-
171
-
172
-
173
-
174
-
175
-
176
-
177
-
178
-
179
-
180
-
181
-
182
-
183
-
184
-
185
-
186
-
187
-
188
-
189
-
190
-
191
-
192
-
193
-
194
-
195
-
196
-
197
-
198
-
199
-
200
-
201
-
202
-
203
-
204
-
205
-
206
-
207
-
208
-
209
-
210
-
211
-
212
-
213
-
214
-
215
-
216
-
217
-
218
-
219
-
220
-
221
-
222
-
223
-
224
 |
 |

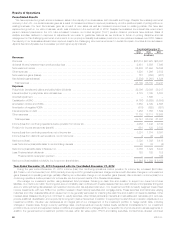
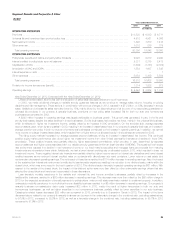
Results of Operations
Consolidated Results
We have experienced growth and an increase in sales in the majority of our businesses, both domestic and foreign. Despite the unsteady economic
recovery in the U.S., our dental business grew as a result of increased enrollment, improved persistency, and the positive impact of pricing actions on
existing business. Our term life business grew as a result of new sales, as well as increased covered lives on existing policies. We have also
experienced growth in our vision business, which was introduced in the second half of 2012. Despite the sustained low interest rate environment,
pension closeout premiums in the U.S. have increased; however, our United Kingdom (“U.K.”) pension closeout premiums have declined. Sales of
variable annuities declined in response to adjustments we made to guarantee features as we continue to focus on pricing discipline and risk
management in this challenging economic environment. In our property & casualty businesses, premiums on new policies increased over 2012. Sales in
the majority of our businesses abroad have improved despite the challenging economic environment in certain European countries and a decrease in
Japan’s fixed annuity sales due to a weaker yen and higher equity markets.
Years Ended December 31,
2013 2012 2011
(In millions)
Revenues
Premiums ....................................................................................... $37,674 $37,975 $36,361
Universal life and investment-type product policy fees ..................................................... 9,451 8,556 7,806
Net investment income ............................................................................. 22,232 21,984 19,585
Other revenues ................................................................................... 1,920 1,906 2,532
Net investment gains (losses) ........................................................................ 161 (352) (867)
Net derivative gains (losses) ......................................................................... (3,239) (1,919) 4,824
Total revenues .................................................................................. 68,199 68,150 70,241
Expenses
Policyholder benefits and claims and policyholder dividends ................................................ 39,366 39,356 36,917
Interest credited to policyholder account balances ........................................................ 8,179 7,729 5,603
Goodwill impairment ............................................................................... – 1,868 –
Capitalization of DAC ............................................................................... (4,786) (5,289) (5,558)
Amortization of DAC and VOBA ....................................................................... 3,550 4,199 4,898
Amortization of negative VOBA ....................................................................... (579) (622) (697)
Interest expense on debt ............................................................................ 1,282 1,356 1,629
Other expenses ................................................................................... 17,135 18,111 18,265
Total expenses ................................................................................. 64,147 66,708 61,057
Income (loss) from continuing operations before provision for income tax ....................................... 4,052 1,442 9,184
Provision for income tax expense (benefit) .............................................................. 661 128 2,793
Income (loss) from continuing operations, net of income tax ................................................. 3,391 1,314 6,391
Income (loss) from discontinued operations, net of income tax ............................................... 2 48 24
Net income (loss) .................................................................................. 3,393 1,362 6,415
Less: Net income (loss) attributable to noncontrolling interests ............................................... 25 38 (8)
Net income (loss) attributable to MetLife, Inc. ............................................................ 3,368 1,324 6,423
Less: Preferred stock dividends ...................................................................... 122 122 122
Preferred stock redemption premium .............................................................. – – 146
Net income (loss) available to MetLife, Inc.’s common shareholders ........................................... $ 3,246 $ 1,202 $ 6,155
Year Ended December 31, 2013 Compared with the Year Ended December 31, 2012
During the year ended December 31, 2013, income (loss) from continuing operations, before provision for income tax, increased $2.6 billion
($2.1 billion, net of income tax) from 2012 primarily driven by a 2012 goodwill impairment charge combined with favorable changes in net investment
gains (losses) and operating earnings, partially offset by an unfavorable change in net derivative gains (losses). Also included in income (loss) from
continuing operations, before provision for income tax, are the improved results of the Divested Businesses.
We manage our investment portfolio using disciplined ALM principles, focusing on cash flow and duration to support our current and future
liabilities. Our intent is to match the timing and amount of liability cash outflows with invested assets that have cash inflows of comparable timing and
amount, while optimizing risk-adjusted net investment income and risk-adjusted total return. Our investment portfolio is heavily weighted toward fixed
income investments, with over 80% of our portfolio invested in fixed maturity securities and mortgage loans. These securities and loans have varying
maturities and other characteristics which cause them to be generally well suited for matching the cash flow and duration of insurance liabilities. Other
invested asset classes including, but not limited to, equity securities, other limited partnership interests and real estate and real estate joint ventures,
provide additional diversification and opportunity for long-term yield enhancement in addition to supporting the cash flow and duration objectives of our
investment portfolio. We also use derivatives as an integral part of our management of the investment portfolio to hedge certain risks, including
changes in interest rates, foreign currency exchange rates, credit spreads and equity market levels. Additional considerations for our investment
portfolio include current and expected market conditions and expectations for changes within our specific mix of products and business segments. In
addition, the general account investment portfolio includes, within fair value option (“FVO”) and trading securities, contractholder-directed unit-linked
20 MetLife, Inc.