MetLife 2013 Annual Report Download - page 143
Download and view the complete annual report
Please find page 143 of the 2013 MetLife annual report below. You can navigate through the pages in the report by either clicking on the pages listed below, or by using the keyword search tool below to find specific information within the annual report.-
 1
1 -
2
-
3
-
4
-
5
-
6
-
7
-
8
-
9
-
10
-
11
-
12
-
13
-
14
-
15
-
16
-
17
-
18
-
19
-
20
-
21
-
22
-
23
-
24
-
25
-
26
-
27
-
28
-
29
-
30
-
31
-
32
-
33
-
34
-
35
-
36
-
37
-
38
-
39
-
40
-
41
-
42
-
43
-
44
-
45
-
46
-
47
-
48
-
49
-
50
-
51
-
52
-
53
-
54
-
55
-
56
-
57
-
58
-
59
-
60
-
61
-
62
-
63
-
64
-
65
-
66
-
67
-
68
-
69
-
70
-
71
-
72
-
73
-
74
-
75
-
76
-
77
-
78
-
79
-
80
-
81
-
82
-
83
-
84
-
85
-
86
-
87
-
88
-
89
-
90
-
91
-
92
-
93
-
94
-
95
-
96
-
97
-
98
-
99
-
100
-
101
-
102
-
103
-
104
-
105
-
106
-
107
-
108
-
109
-
110
-
111
-
112
-
113
-
114
-
115
-
116
-
117
-
118
-
119
-
120
-
121
-
122
-
123
-
124
-
125
-
126
-
127
-
128
-
129
-
130
-
131
-
132
-
 133
133 -
 134
134 -
 135
135 -
 136
136 -
 137
137 -
 138
138 -
 139
139 -
 140
140 -
 141
141 -
 142
142 -
 143
143 -
 144
144 -
 145
145 -
 146
146 -
 147
147 -
 148
148 -
 149
149 -
 150
150 -
 151
151 -
 152
152 -
 153
153 -
154
-
155
-
156
-
157
-
158
-
159
-
160
-
161
-
162
-
163
-
164
-
165
-
166
-
167
-
168
-
169
-
170
-
171
-
172
-
173
-
174
-
175
-
176
-
177
-
178
-
179
-
180
-
181
-
182
-
183
-
184
-
185
-
186
-
187
-
188
-
189
-
190
-
191
-
192
-
193
-
194
-
195
-
196
-
197
-
198
-
199
-
200
-
201
-
202
-
203
-
204
-
205
-
206
-
207
-
208
-
209
-
210
-
211
-
212
-
213
-
214
-
215
-
216
-
217
-
218
-
219
-
220
-
221
-
222
-
223
-
224
 |
 |

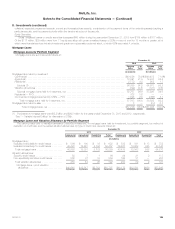
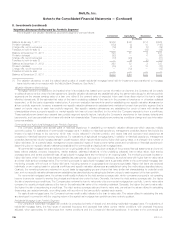
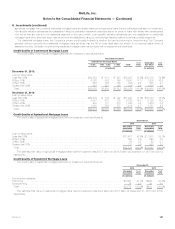
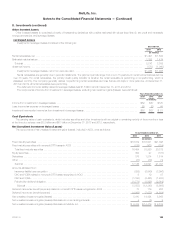
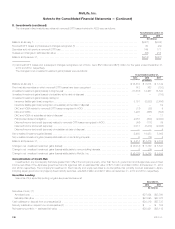
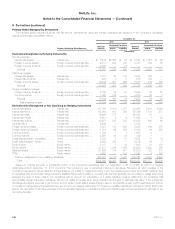
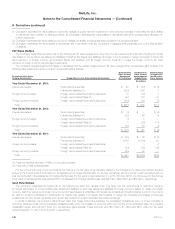
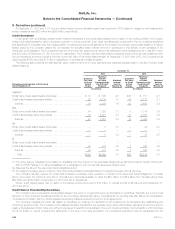
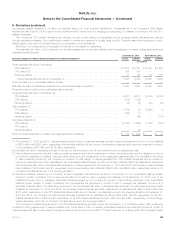
MetLife, Inc.
Notes to the Consolidated Financial Statements — (Continued)
8. Investments (continued)
Net Investment Income
The components of net investment income were as follows:
Years Ended December 31,
2013 2012 2011
(In millions)
Investment income:
Fixed maturity securities ....................................................................... $15,071 $15,218 $15,037
Equity securities ............................................................................. 127 133 141
FVO and trading securities — Actively Traded Securities and FVO general account securities (1) ............... 65 88 31
Mortgage loans .............................................................................. 3,020 3,191 3,164
Policy loans ................................................................................ 620 626 641
Real estate and real estate joint ventures .......................................................... 909 834 688
Other limited partnership interests ............................................................... 955 845 681
Cash, cash equivalents and short-term investments ................................................. 181 163 167
International joint ventures ...................................................................... 10 19 (12)
Other ..................................................................................... 165 131 178
Subtotal ................................................................................. 21,123 21,248 20,716
Less: Investment expenses .................................................................... 1,198 1,090 1,019
Subtotal, net ................................................................................ 19,925 20,158 19,697
FVO and trading securities — FVO contractholder-directed unit-linked investments (1) ......................... 2,172 1,473 (453)
Securitized reverse residential mortgage loans ........................................................ — 177 —
FVO CSEs - interest income:
Commercial mortgage loans .................................................................... 132 172 332
Securities ................................................................................... 3 4 9
Subtotal ................................................................................. 2,307 1,826 (112)
Net investment income .................................................................... $22,232 $21,984 $19,585
(1) Changes in estimated fair value subsequent to purchase for securities still held as of the end of the respective years included in net investment
income were as follows:
Years Ended December 31,
2013 2012 2011
(In millions)
Actively Traded Securities and FVO general account securities ............................................... $ 18 $ 51 $ (3)
FVO contractholder-directed unit-linked investments ....................................................... $1,579 $1,170 $(647)
See “— Variable Interest Entities” for discussion of CSEs.
MetLife, Inc. 135