MetLife 2013 Annual Report Download - page 55
Download and view the complete annual report
Please find page 55 of the 2013 MetLife annual report below. You can navigate through the pages in the report by either clicking on the pages listed below, or by using the keyword search tool below to find specific information within the annual report.-
 1
1 -
2
-
3
-
4
-
5
-
6
-
7
-
8
-
9
-
10
-
11
-
12
-
13
-
14
-
15
-
16
-
17
-
18
-
19
-
20
-
21
-
22
-
23
-
24
-
25
-
26
-
27
-
28
-
29
-
30
-
31
-
32
-
33
-
34
-
35
-
36
-
37
-
38
-
39
-
40
-
41
-
42
-
43
-
44
-
 45
45 -
 46
46 -
 47
47 -
 48
48 -
 49
49 -
 50
50 -
 51
51 -
 52
52 -
 53
53 -
 54
54 -
 55
55 -
 56
56 -
 57
57 -
 58
58 -
 59
59 -
 60
60 -
 61
61 -
 62
62 -
 63
63 -
 64
64 -
 65
65 -
66
-
67
-
68
-
69
-
70
-
71
-
72
-
73
-
74
-
75
-
76
-
77
-
78
-
79
-
80
-
81
-
82
-
83
-
84
-
85
-
86
-
87
-
88
-
89
-
90
-
91
-
92
-
93
-
94
-
95
-
96
-
97
-
98
-
99
-
100
-
101
-
102
-
103
-
104
-
105
-
106
-
107
-
108
-
109
-
110
-
111
-
112
-
113
-
114
-
115
-
116
-
117
-
118
-
119
-
120
-
121
-
122
-
123
-
124
-
125
-
126
-
127
-
128
-
129
-
130
-
131
-
132
-
133
-
134
-
135
-
136
-
137
-
138
-
139
-
140
-
141
-
142
-
143
-
144
-
145
-
146
-
147
-
148
-
149
-
150
-
151
-
152
-
153
-
154
-
155
-
156
-
157
-
158
-
159
-
160
-
161
-
162
-
163
-
164
-
165
-
166
-
167
-
168
-
169
-
170
-
171
-
172
-
173
-
174
-
175
-
176
-
177
-
178
-
179
-
180
-
181
-
182
-
183
-
184
-
185
-
186
-
187
-
188
-
189
-
190
-
191
-
192
-
193
-
194
-
195
-
196
-
197
-
198
-
199
-
200
-
201
-
202
-
203
-
204
-
205
-
206
-
207
-
208
-
209
-
210
-
211
-
212
-
213
-
214
-
215
-
216
-
217
-
218
-
219
-
220
-
221
-
222
-
223
-
224
 |
 |

At December 31, 2013, our Alt-A RMBS portfolio had $34 million, at estimated fair value, of exposure to option adjustable rate mortgage loans. The
mortgage loans backing these securities are past the initial period that allowed negative amortization of principal and are now traditional amortizing
adjustable rate mortgages. At December 31, 2012, our Alt-A RMBS portfolio had no exposure to option adjustable rate mortgage loans. At
December 31, 2013 and 2012, our Alt-A RMBS portfolio was comprised primarily of fixed rate mortgage loans (94% at both December 31, 2013 and
2012).
Historically, we have managed our exposure to sub-prime RMBS holdings by acquiring older vintage year securities that benefit from better
underwriting, improved credit enhancement and higher levels of residential property price appreciation; reducing our overall exposure; stress testing the
portfolio with severe loss assumptions and closely monitoring the performance of the portfolio. In 2013 and 2012, we increased our exposure by
purchasing sub-prime RMBS at significant discounts to the expected principal recovery value of these securities. The 2012 and 2013 sub-prime
RMBS purchases are performing within our expectations and were in an unrealized gain position of $96 million and $59 million at December 31, 2013
and 2012, respectively.
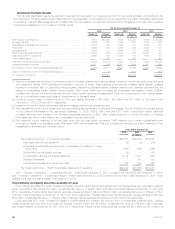
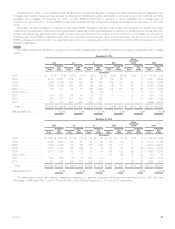
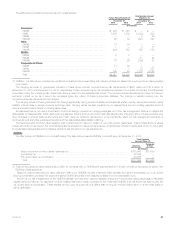
CMBS
Our CMBS holdings are diversified by vintage year. The following tables present our CMBS holdings by rating agency designation and by vintage
year at:
December 31, 2013
Aaa Aa A Baa
Below
Investment
Grade Total
Amortized
Cost
Estimated
Fair
Value Amortized
Cost
Estimated
Fair
Value Amortized
Cost
Estimated
Fair
Value Amortized
Cost
Estimated
Fair
Value Amortized
Cost
Estimated
Fair
Value Amortized
Cost
Estimated
Fair
Value
(In millions)
2003 ..................... $ 65 $ 71 $ 15 $ 15 $ 28 $ 28 $ 28 $ 29 $ 15 $ 15 $ 151 $ 158
2004 ..................... 2,418 2,451 212 221 90 96 64 66 7 6 2,791 2,840
2005 ..................... 3,294 3,442 363 387 372 393 102 110 29 36 4,160 4,368
2006 ..................... 2,355 2,466 246 260 145 156 16 21 36 37 2,798 2,940
2007 ..................... 782 814 65 70 208 220 184 187 75 69 1,314 1,360
2008 - 2010 ............... — — — — 55 52 1 1 8 9 64 62
2011 ..................... 587 613 25 24 87 87 — — 5 4 704 728
2012 ..................... 439 477 271 264 937 892 — — 17 51 1,664 1,684
2013 ..................... 719 715 396 384 1,354 1,311 — — — — 2,469 2,410
Total ................... $10,659 $11,049 $ 1,593 $ 1,625 $ 3,276 $ 3,235 $ 395 $ 414 $ 192 $ 227 $16,115 $16,550
Ratings Distribution .......... 66.8% 9.8% 19.5% 2.5% 1.4% 100.0%
December 31, 2012
Aaa Aa A Baa
Below
Investment
Grade Total
Amortized
Cost
Estimated
Fair
Value Amortized
Cost
Estimated
Fair
Value Amortized
Cost
Estimated
Fair
Value Amortized
Cost
Estimated
Fair
Value Amortized
Cost
Estimated
Fair
Value Amortized
Cost
Estimated
Fair
Value
(In millions)
2003 .....................$ 2,957 $ 2,997 $ 113 $ 114 $ 82 $ 82 $ 37 $ 36 $ 33 $ 33 $ 3,222 $ 3,262
2004 ..................... 3,466 3,606 380 401 97 99 52 51 21 9 4,016 4,166
2005 ..................... 3,348 3,636 303 329 275 296 144 142 — — 4,070 4,403
2006 ..................... 2,283 2,484 263 284 44 44 47 50 38 36 2,675 2,898
2007 ..................... 1,070 1,143 112 117 87 95 194 187 20 21 1,483 1,563
2008 - 2010 ............... 2 3 — — — — 56 60 26 24 84 87
2011 ..................... 598 650 12 11 108 112 — — 7 6 725 779
2012 ..................... 524 559 403 417 939 956 — — 36 39 1,902 1,971
Total ...................$14,248 $15,078 $ 1,586 $ 1,673 $1,632 $ 1,684 $ 530 $ 526 $ 181 $ 168 $18,177 $19,129
Ratings Distribution .......... 78.8% 8.7% 8.8% 2.8% 0.9% 100.0%
The tables above reflect rating agency designations assigned by nationally recognized rating agencies including Moody’s, S&P, Fitch and
Morningstar. CMBS rated NAIC 1 were 99.1% and 98.5% of total CMBS at December 31, 2013 and 2012, respectively.
MetLife, Inc. 47