MetLife 2013 Annual Report Download - page 111
Download and view the complete annual report
Please find page 111 of the 2013 MetLife annual report below. You can navigate through the pages in the report by either clicking on the pages listed below, or by using the keyword search tool below to find specific information within the annual report.-
 1
1 -
2
-
3
-
4
-
5
-
6
-
7
-
8
-
9
-
10
-
11
-
12
-
13
-
14
-
15
-
16
-
17
-
18
-
19
-
20
-
21
-
22
-
23
-
24
-
25
-
26
-
27
-
28
-
29
-
30
-
31
-
32
-
33
-
34
-
35
-
36
-
37
-
38
-
39
-
40
-
41
-
42
-
43
-
44
-
45
-
46
-
47
-
48
-
49
-
50
-
51
-
52
-
53
-
54
-
55
-
56
-
57
-
58
-
59
-
60
-
61
-
62
-
63
-
64
-
65
-
66
-
67
-
68
-
69
-
70
-
71
-
72
-
73
-
74
-
75
-
76
-
77
-
78
-
79
-
80
-
81
-
82
-
83
-
84
-
85
-
86
-
87
-
88
-
89
-
90
-
91
-
92
-
93
-
94
-
95
-
96
-
97
-
98
-
99
-
100
-
 101
101 -
 102
102 -
 103
103 -
 104
104 -
 105
105 -
 106
106 -
 107
107 -
 108
108 -
 109
109 -
 110
110 -
 111
111 -
 112
112 -
 113
113 -
 114
114 -
 115
115 -
 116
116 -
 117
117 -
 118
118 -
 119
119 -
 120
120 -
 121
121 -
122
-
123
-
124
-
125
-
126
-
127
-
128
-
129
-
130
-
131
-
132
-
133
-
134
-
135
-
136
-
137
-
138
-
139
-
140
-
141
-
142
-
143
-
144
-
145
-
146
-
147
-
148
-
149
-
150
-
151
-
152
-
153
-
154
-
155
-
156
-
157
-
158
-
159
-
160
-
161
-
162
-
163
-
164
-
165
-
166
-
167
-
168
-
169
-
170
-
171
-
172
-
173
-
174
-
175
-
176
-
177
-
178
-
179
-
180
-
181
-
182
-
183
-
184
-
185
-
186
-
187
-
188
-
189
-
190
-
191
-
192
-
193
-
194
-
195
-
196
-
197
-
198
-
199
-
200
-
201
-
202
-
203
-
204
-
205
-
206
-
207
-
208
-
209
-
210
-
211
-
212
-
213
-
214
-
215
-
216
-
217
-
218
-
219
-
220
-
221
-
222
-
223
-
224
 |
 |

MetLife, Inc.
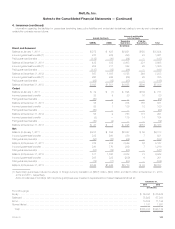
Notes to the Consolidated Financial Statements — (Continued)
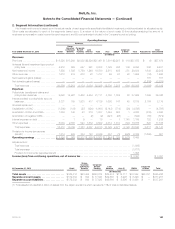
2. Segment Information (continued)
Net investment income is based upon the actual results of each segment’s specifically identifiable investment portfolios adjusted for allocated equity.
Other costs are allocated to each of the segments based upon: (i) a review of the nature of such costs; (ii) time studies analyzing the amount of
employee compensation costs incurred by each segment; and (iii) cost estimates included in the Company’s product pricing.
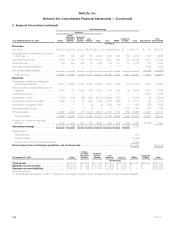
Operating Earnings
Americas
Year Ended December 31, 2013 Retail
Group,
Voluntary
& Worksite
Benefits
Corporate
Benefit
Funding Latin
America Total Asia EMEA Corporate
& Other Total Adjustments Total
Consolidated
(In millions)
Revenues
Premiums .......................... $ 6,528 $15,250 $2,859 $2,824 $27,461 $ 7,801 $2,297 $ 116 $37,675 $ (1) $37,674
Universal life and investment-type product
policy fees ....................... 4,912 688 247 991 6,838 1,722 386 139 9,085 366 9,451
Net investment income ............... 7,898 1,856 5,790 1,246 16,790 2,915 498 381 20,584 1,648 22,232
Other revenues ..................... 1,018 418 278 23 1,737 92 97 28 1,954 (34) 1,920
Net investment gains (losses) ........... — — — — — — — — — 161 161
Net derivative gains (losses) ............ — — — — — — — — — (3,239) (3,239)
Total revenues .................... 20,356 18,212 9,174 5,084 52,826 12,530 3,278 664 69,298 (1,099) 68,199
Expenses
Policyholder benefits and claims and
policyholder dividends .............. 9,028 14,227 5,402 2,454 31,111 5,755 1,039 63 37,968 1,398 39,366
Interest credited to policyholder account
balances ......................... 2,331 155 1,233 417 4,136 1,690 147 42 6,015 2,164 8,179
Goodwill impairment .................. — — — — — — — — — — —
Capitalization of DAC ................. (1,309) (141) (27) (424) (1,901) (2,143) (714) (28) (4,786) — (4,786)
Amortization of DAC and VOBA ......... 1,384 140 23 310 1,857 1,542 683 1 4,083 (533) 3,550
Amortization of negative VOBA .......... — — — (2) (2) (427) (95) — (524) (55) (579)
Interest expense on debt .............. — 1 9 — 10 — 1 1,148 1,159 123 1,282
Other expenses ..................... 5,084 2,380 523 1,612 9,599 4,312 1,810 894 16,615 520 17,135
Total expenses .................... 16,518 16,762 7,163 4,367 44,810 10,729 2,871 2,120 60,530 3,617 64,147
Provision for income tax expense
(benefit) ......................... 1,314 488 704 143 2,649 557 78 (925) 2,359 (1,698) 661
Operating earnings ................ $ 2,524 $ 962 $1,307 $ 574 $ 5,367 $ 1,244 $ 329 $ (531) 6,409
Adjustments to:
Total revenues ............................................................................... (1,099)
Total expenses ............................................................................... (3,617)
Provision for income tax (expense) benefit .......................................................... 1,698
Income (loss) from continuing operations, net of income tax ....................................... $ 3,391 $ 3,391
At December 31, 2013 Retail
Group,
Voluntary
& Worksite
Benefits
Corporate
Benefit
Funding Latin
America Asia (1) EMEA Corporate
& Other Total
(In millions)
Total assets .............................. $349,516 $43,404 $220,612 $69,874 $119,717 $33,382 $48,791 $885,296
Separate account assets .................. $172,382 $ 644 $ 77,023 $49,660 $ 8,996 $ 8,496 $ — $317,201
Separate account liabilities ................ $172,382 $ 644 $ 77,023 $49,660 $ 8,996 $ 8,496 $ — $317,201
(1) Total assets includes $98.4 billion of assets from the Japan operations which represents 11% of total consolidated assets.
MetLife, Inc. 103