MetLife 2013 Annual Report Download - page 144
Download and view the complete annual report
Please find page 144 of the 2013 MetLife annual report below. You can navigate through the pages in the report by either clicking on the pages listed below, or by using the keyword search tool below to find specific information within the annual report.-
 1
1 -
2
-
3
-
4
-
5
-
6
-
7
-
8
-
9
-
10
-
11
-
12
-
13
-
14
-
15
-
16
-
17
-
18
-
19
-
20
-
21
-
22
-
23
-
24
-
25
-
26
-
27
-
28
-
29
-
30
-
31
-
32
-
33
-
34
-
35
-
36
-
37
-
38
-
39
-
40
-
41
-
42
-
43
-
44
-
45
-
46
-
47
-
48
-
49
-
50
-
51
-
52
-
53
-
54
-
55
-
56
-
57
-
58
-
59
-
60
-
61
-
62
-
63
-
64
-
65
-
66
-
67
-
68
-
69
-
70
-
71
-
72
-
73
-
74
-
75
-
76
-
77
-
78
-
79
-
80
-
81
-
82
-
83
-
84
-
85
-
86
-
87
-
88
-
89
-
90
-
91
-
92
-
93
-
94
-
95
-
96
-
97
-
98
-
99
-
100
-
101
-
102
-
103
-
104
-
105
-
106
-
107
-
108
-
109
-
110
-
111
-
112
-
113
-
114
-
115
-
116
-
117
-
118
-
119
-
120
-
121
-
122
-
123
-
124
-
125
-
126
-
127
-
128
-
129
-
130
-
131
-
132
-
133
-
 134
134 -
 135
135 -
 136
136 -
 137
137 -
 138
138 -
 139
139 -
 140
140 -
 141
141 -
 142
142 -
 143
143 -
 144
144 -
 145
145 -
 146
146 -
 147
147 -
 148
148 -
 149
149 -
 150
150 -
 151
151 -
 152
152 -
 153
153 -
 154
154 -
155
-
156
-
157
-
158
-
159
-
160
-
161
-
162
-
163
-
164
-
165
-
166
-
167
-
168
-
169
-
170
-
171
-
172
-
173
-
174
-
175
-
176
-
177
-
178
-
179
-
180
-
181
-
182
-
183
-
184
-
185
-
186
-
187
-
188
-
189
-
190
-
191
-
192
-
193
-
194
-
195
-
196
-
197
-
198
-
199
-
200
-
201
-
202
-
203
-
204
-
205
-
206
-
207
-
208
-
209
-
210
-
211
-
212
-
213
-
214
-
215
-
216
-
217
-
218
-
219
-
220
-
221
-
222
-
223
-
224
 |
 |

MetLife, Inc.
Notes to the Consolidated Financial Statements — (Continued)
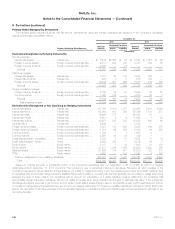
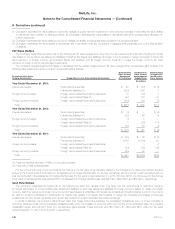
8. Investments (continued)
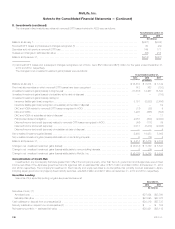
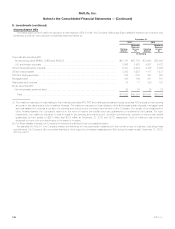
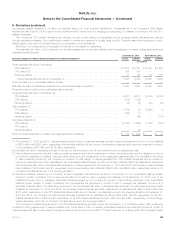
Net Investment Gains (Losses)
Components of Net Investment Gains (Losses)
The components of net investment gains (losses) were as follows:
Years Ended December 31,
2013 2012 2011
(In millions)
Total gains (losses) on fixed maturity securities:
Total OTTI losses recognized — by sector and industry:
U.S. and foreign corporate securities — by industry:
Utility ........................................................................................ $ (48) $ (61) $ (10)
Consumer .................................................................................... (11) (19) (50)
Finance ...................................................................................... (10) (32) (56)
Transportation ................................................................................. (3) (17) —
Communications ............................................................................... (2) (19) (41)
Technology ................................................................................... — (6) (1)
Industrial ...................................................................................... — (5) (11)
Total U.S. and foreign corporate securities ......................................................... (74) (159) (169)
RMBS ......................................................................................... (80) (97) (214)
CMBS ......................................................................................... (12) (51) (32)
ABS ........................................................................................... — (9) (54)
State and political subdivision ....................................................................... — (1) —
Foreign government ............................................................................... — — (486)
OTTI losses on fixed maturity securities recognized in earnings ............................................... (166) (317) (955)
Fixed maturity securities — net gains (losses) on sales and disposals .......................................... 561 253 25
Total gains (losses) on fixed maturity securities (1) ........................................................ 395 (64) (930)
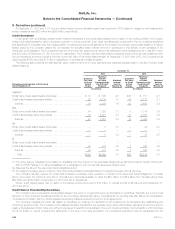
Total gains (losses) on equity securities:
Total OTTI losses recognized — by sector:
Non-redeemable preferred stock ..................................................................... (20) — (38)
Common stock .................................................................................. (6) (34) (22)
OTTI losses on equity securities recognized in earnings ..................................................... (26) (34) (60)
Equity securities — net gains (losses) on sales and disposals ................................................ 31 38 37
Total gains (losses) on equity securities ................................................................ 5 4 (23)
FVO and trading securities — FVO general account securities ................................................ 15 17 (2)
Mortgage loans (1) .................................................................................. 22 57 175
Real estate and real estate joint ventures ................................................................ (19) (36) 134
Other limited partnership interests ...................................................................... (48) (36) 4
Other investment portfolio gains (losses) ................................................................. 22 (151) (7)
Subtotal — investment portfolio gains (losses) (1) ...................................................... 392 (209) (649)
FVO CSEs:
Commercial mortgage loans .......................................................................... (52) 7 (84)
Securities ......................................................................................... 2 — —
Long-term debt — related to commercial mortgage loans ................................................... 85 25 97
Long-term debt — related to securities .................................................................. (2) (7) (8)
Non-investment portfolio gains (losses) (2) ................................................................. (264) (168) (223)
Subtotal FVO CSEs and non-investment portfolio gains (losses) ......................................... (231) (143) (218)
Total net investment gains (losses) ............................................................. $161 $(352) $(867)
(1) Investment portfolio gains (losses) for the years ended December 31, 2012 and 2011 includes a net gain (loss) of $37 million and ($153) million,
respectively, as a result of the MetLife Bank Divestiture, which is comprised of gains (losses) on investments sold of $78 million and $1 million,
respectively, and impairments on mortgage loans of ($41) million and ($154) million, respectively. See Note 3.
136 MetLife, Inc.