MetLife 2013 Annual Report Download - page 59
Download and view the complete annual report
Please find page 59 of the 2013 MetLife annual report below. You can navigate through the pages in the report by either clicking on the pages listed below, or by using the keyword search tool below to find specific information within the annual report.-
 1
1 -
2
-
3
-
4
-
5
-
6
-
7
-
8
-
9
-
10
-
11
-
12
-
13
-
14
-
15
-
16
-
17
-
18
-
19
-
20
-
21
-
22
-
23
-
24
-
25
-
26
-
27
-
28
-
29
-
30
-
31
-
32
-
33
-
34
-
35
-
36
-
37
-
38
-
39
-
40
-
41
-
42
-
43
-
44
-
45
-
46
-
47
-
48
-
 49
49 -
 50
50 -
 51
51 -
 52
52 -
 53
53 -
 54
54 -
 55
55 -
 56
56 -
 57
57 -
 58
58 -
 59
59 -
 60
60 -
 61
61 -
 62
62 -
 63
63 -
 64
64 -
 65
65 -
 66
66 -
 67
67 -
 68
68 -
 69
69 -
70
-
71
-
72
-
73
-
74
-
75
-
76
-
77
-
78
-
79
-
80
-
81
-
82
-
83
-
84
-
85
-
86
-
87
-
88
-
89
-
90
-
91
-
92
-
93
-
94
-
95
-
96
-
97
-
98
-
99
-
100
-
101
-
102
-
103
-
104
-
105
-
106
-
107
-
108
-
109
-
110
-
111
-
112
-
113
-
114
-
115
-
116
-
117
-
118
-
119
-
120
-
121
-
122
-
123
-
124
-
125
-
126
-
127
-
128
-
129
-
130
-
131
-
132
-
133
-
134
-
135
-
136
-
137
-
138
-
139
-
140
-
141
-
142
-
143
-
144
-
145
-
146
-
147
-
148
-
149
-
150
-
151
-
152
-
153
-
154
-
155
-
156
-
157
-
158
-
159
-
160
-
161
-
162
-
163
-
164
-
165
-
166
-
167
-
168
-
169
-
170
-
171
-
172
-
173
-
174
-
175
-
176
-
177
-
178
-
179
-
180
-
181
-
182
-
183
-
184
-
185
-
186
-
187
-
188
-
189
-
190
-
191
-
192
-
193
-
194
-
195
-
196
-
197
-
198
-
199
-
200
-
201
-
202
-
203
-
204
-
205
-
206
-
207
-
208
-
209
-
210
-
211
-
212
-
213
-
214
-
215
-
216
-
217
-
218
-
219
-
220
-
221
-
222
-
223
-
224
 |
 |

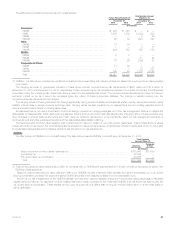
In connection with our investment management business, in the fourth quarter of 2013, we contributed real estate investments with an estimated fair
value of $1.4 billion to the MetLife Core Property Fund, our newly formed open ended core real estate fund, in return for the issuance of ownership
interests in that fund. As part of the initial closing on December 31, 2013, we redeemed 76% of our interest in this fund as new third party investors
were admitted. The MetLife Core Property Fund is consolidated as of December 31, 2013. See Note 8 of the Notes to Consolidated Financial
Statements for further information.
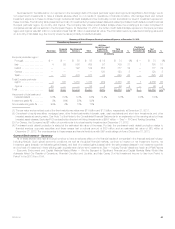
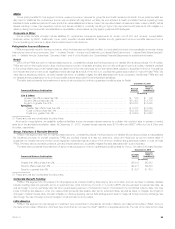
Real estate and real estate joint venture investments by property type are categorized by sector as follows at:
December 31,
2013 2012
Carrying
Value %of
Total Carrying
Value %of
Total
(In millions) (In millions)
Office .............................................................. $ 5,440 50.8% $5,789 58.4%
Apartment .......................................................... 2,176 20.3 1,717 17.3
Industrial ........................................................... 696 6.5 598 6.0
Retail .............................................................. 684 6.4 416 4.2
Hotel .............................................................. 429 4.0 372 3.7
Real estate investment funds ............................................ 394 3.7 451 4.6
Land .............................................................. 333 3.1 265 2.7
Agriculture .......................................................... 35 0.3 8 0.1
Other .............................................................. 525 4.9 302 3.0
Total real estate and real estate joint ventures .............................. $10,712 100.0% $9,918 100.0%
We committed to acquire interests in real estate property with a gross value of $2.9 billion in each of the years ended December 31, 2013 and 2012.
The Company’s authorized equity investment in such properties was $1.9 billion and $1.8 billion during the same periods, respectively. Impairments
recognized on real estate and real estate joint ventures were $10 million, $20 million and $2 million for the years ended December 31, 2013, 2012 and
2011, respectively. Depreciation expense on real estate investments was $179 million, $168 million and $164 million for the years ended December 31,
2013, 2012 and 2011, respectively. Real estate investments are net of accumulated depreciation of $1.3 billion at both December 31, 2013 and 2012.
Other Limited Partnership Interests
The carrying value of other limited partnership interests was $7.4 billion and $6.7 billion at December 31, 2013 and 2012 respectively, which
included $1.9 billion and $1.4 billion of hedge funds, at December 31, 2013 and 2012, respectively.
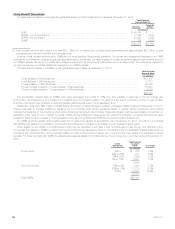
Other Invested Assets
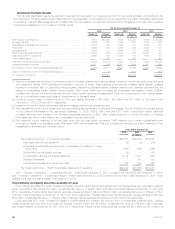
The following table presents the carrying value of our other invested assets by type:
December 31,
2013 2012
Carrying
Value %of
Total Carrying
Value %of
Total
(In millions) (In millions)
Freestanding derivatives with positive estimated fair values ..................... $ 8,595 53.0% $13,777 65.2%
Tax credit and renewable energy partnerships .............................. 2,657 16.3 2,268 10.7
Leveraged leases, net of non-recourse debt ................................ 1,946 12.0 1,998 9.4
Funds withheld ...................................................... 649 4.0 641 3.0
Joint venture investments .............................................. 113 0.7 180 0.9
Other .............................................................. 2,269 14.0 2,281 10.8
Total ............................................................. $16,229 100.0% $21,145 100.0%
Leveraged lease impairments were $26 million, $203 million and $4 million for the years ended December 31, 2013, 2012 and 2011, respectively.
See Notes 8 and 9 of the Notes to the Consolidated Financial Statements for information regarding leveraged leases and the freestanding
derivatives with positive estimated fair values, respectively. Tax credit and renewable energy partnerships are established for the purpose of investing in
low-income housing, other social causes and renewable energy generation facilities, where a significant source of the return on investment is in the form
of income tax credits or other tax incentives, and are accounted for under the equity method or under the effective yield method. Funds withheld
represent amounts contractually withheld by ceding companies in accordance with reinsurance agreements. Joint venture investments are accounted
for under the equity method and represent our investment in insurance underwriting joint ventures.
Our private placement unit originated $6.7 billion and $8.1 billion of private investments, comprised primarily of certain privately placed fixed maturity
securities, tax credit and renewable energy partnerships and lease investments, during the years ended December 31, 2013 and 2012, respectively.
The carrying value of such private investments included within our consolidated balance sheets was $50.6 billion and $52.9 billion at December 31,
2013 and 2012, respectively.
Short-term Investments and Cash Equivalents
The carrying value of short-term investments, which approximates estimated fair value, was $14.0 billion and $16.9 billion, or 2.8% and 3.2% of total
cash and invested assets, at December 31, 2013 and 2012, respectively. The carrying value of cash equivalents, which approximates estimated fair
value, was $3.8 billion and $6.1 billion, or 0.8% and 1.1% of total cash and invested assets, at December 31, 2013 and 2012, respectively.
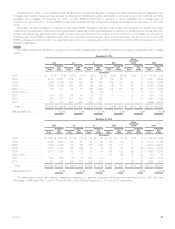
Derivatives
Derivative Risks
We are exposed to various risks relating to our ongoing business operations, including interest rate, foreign currency exchange rate, credit and
equity market. We use a variety of strategies to manage these risks, including the use of derivatives. See Note 9 of the Notes to the Consolidated
Financial Statements for:
‰A comprehensive description of the nature of our derivatives, including the strategies for which derivatives are used in managing various risks.
‰Information about the notional amount, estimated fair value, and primary underlying risk exposure of our derivatives by type of hedge designation,
excluding embedded derivatives held at December 31, 2013 and 2012.
MetLife, Inc. 51