MetLife 2013 Annual Report Download - page 46
Download and view the complete annual report
Please find page 46 of the 2013 MetLife annual report below. You can navigate through the pages in the report by either clicking on the pages listed below, or by using the keyword search tool below to find specific information within the annual report.-
 1
1 -
2
-
3
-
4
-
5
-
6
-
7
-
8
-
9
-
10
-
11
-
12
-
13
-
14
-
15
-
16
-
17
-
18
-
19
-
20
-
21
-
22
-
23
-
24
-
25
-
26
-
27
-
28
-
29
-
30
-
31
-
32
-
33
-
34
-
35
-
 36
36 -
 37
37 -
 38
38 -
 39
39 -
 40
40 -
 41
41 -
 42
42 -
 43
43 -
 44
44 -
 45
45 -
 46
46 -
 47
47 -
 48
48 -
 49
49 -
 50
50 -
 51
51 -
 52
52 -
 53
53 -
 54
54 -
 55
55 -
 56
56 -
57
-
58
-
59
-
60
-
61
-
62
-
63
-
64
-
65
-
66
-
67
-
68
-
69
-
70
-
71
-
72
-
73
-
74
-
75
-
76
-
77
-
78
-
79
-
80
-
81
-
82
-
83
-
84
-
85
-
86
-
87
-
88
-
89
-
90
-
91
-
92
-
93
-
94
-
95
-
96
-
97
-
98
-
99
-
100
-
101
-
102
-
103
-
104
-
105
-
106
-
107
-
108
-
109
-
110
-
111
-
112
-
113
-
114
-
115
-
116
-
117
-
118
-
119
-
120
-
121
-
122
-
123
-
124
-
125
-
126
-
127
-
128
-
129
-
130
-
131
-
132
-
133
-
134
-
135
-
136
-
137
-
138
-
139
-
140
-
141
-
142
-
143
-
144
-
145
-
146
-
147
-
148
-
149
-
150
-
151
-
152
-
153
-
154
-
155
-
156
-
157
-
158
-
159
-
160
-
161
-
162
-
163
-
164
-
165
-
166
-
167
-
168
-
169
-
170
-
171
-
172
-
173
-
174
-
175
-
176
-
177
-
178
-
179
-
180
-
181
-
182
-
183
-
184
-
185
-
186
-
187
-
188
-
189
-
190
-
191
-
192
-
193
-
194
-
195
-
196
-
197
-
198
-
199
-
200
-
201
-
202
-
203
-
204
-
205
-
206
-
207
-
208
-
209
-
210
-
211
-
212
-
213
-
214
-
215
-
216
-
217
-
218
-
219
-
220
-
221
-
222
-
223
-
224
 |
 |

The Company reports certain of its results of operations in Corporate & Other. Corporate & Other contains the excess capital not allocated to the
segments, external integration costs, internal resource costs for associates committed to acquisitions, enterprise-wide strategic initiative restructuring
charges, and various other business activities including start-up and certain run-off businesses. Start-up businesses include expatriate benefits
insurance, as well as direct and digital marketing products. Corporate & Other also includes assumed reinsurance of certain variable annuity products
from our former operating joint venture in Japan. Under this in-force reinsurance agreement, we reinsure living and death benefit guarantees issued in
connection with variable annuity products. Corporate & Other also includes our investment management business through which we offer fee-based
investment management services to institutional clients. Additionally, Corporate & Other includes interest expense related to the majority of the
Company’s outstanding debt and expenses associated with certain legal proceedings and income tax audit issues. Corporate & Other also includes the
elimination of intersegment amounts, which generally relate to intersegment loans, which bear interest rates commensurate with related borrowings. The
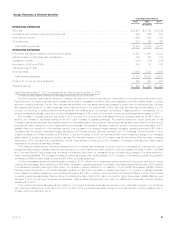
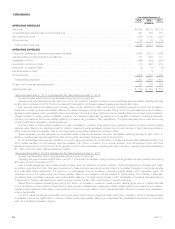
table below presents operating earnings available to common shareholders by source:
Years Ended
December 31,
2013 2012
(In millions)
Other business activities ...................................................................................... $ 62 $ 46
Other net investment income ................................................................................... 248 460
Interest expense on debt ...................................................................................... (747) (764)
Preferred stock dividends ..................................................................................... (122) (122)
Acquisition costs ............................................................................................ (18) (37)
Corporate initiatives and projects ................................................................................ (134) (114)
Incremental tax benefit ........................................................................................ 415 347
Other (including asbestos litigation) .............................................................................. (357) (207)
Operating earnings available to common shareholders ............................................................. $(653) $(391)
Year Ended December 31, 2013 Compared with the Year Ended December 31, 2012
Unless otherwise stated, all amounts discussed below are net of income tax.
Operating earnings available to common shareholders and operating earnings each decreased $262 million, primarily due to lower net investment
income, higher other expenses and lower earnings on invested assets that were funded using Federal Home Loan Bank (“FHLB”) advances. These
decreases were partially offset by a higher tax benefit over 2012 and higher operating earnings from the assumed reinsurance of a variable annuity
business.
Operating earnings from other business activities increased $16 million. This was due to higher operating earnings from the assumed reinsurance
of certain variable annuity products from our former operating joint venture in Japan, partially offset by losses from start-up operations. The increase in
operating earnings was primarily due to higher returns in 2013 and reserve assumption updates in 2012.
Other net investment income decreased $185 million, excluding the FHLB advances and the divested MetLife Bank operations. This decrease
was driven by an increase in the amount credited to the segments due to growth in the economic capital managed by Corporate & Other on their
behalf and lower returns on our fixed maturity securities, real estate joint ventures and alternative investments, partially offset by higher income on our
credit derivatives and real estate investments.
Acquisition costs in 2013 include $19 million of lower internal resource costs for associates committed to certain acquisition activities. Expenses
associated with corporate initiatives and projects increased $20 million, primarily due to a $13 million increase in expenses associated with the
Company’s enterprise-wide strategic initiative, which includes a $29 million decrease in the portion that represents restructuring charges, the majority
of which related to severance. We also incurred $7 million in additional costs related to regulatory requirements for bank holding companies.
Corporate & Other benefits from the impact of certain permanent tax differences, including non-taxable investment income and tax credits for
investments in low income housing. As a result, our effective tax rate differs from the U.S. statutory rate of 35%. In 2013, we benefited primarily from
higher utilization of tax preferenced investments which improved operating earnings by $68 million from 2012.
Our results for 2013 include a $101 million accrual to increase the litigation reserve related to asbestos and $24 million of higher costs associated
with interest on uncertain tax positions. In addition, in 2012, the Company benefited from the positive resolution of certain legal matters totaling $16
million and from a release of rental liability of $15 million. Partially offsetting these decreases in operating earnings was a 2012 charge of $26 million,
representing a multi-state examination payment related to unclaimed property and MetLife’s use of the U.S. Social Security Administration’s Death
Master File.
Operating earnings on invested assets that were funded using FHLB advances decreased $10 million, reflected by decreases in net investment
income and interest expense on debt, due to the transfer of $3.8 billion of FHLB advances and underlying assets from MetLife Bank to Corporate
Benefit Funding in April 2012.
Year Ended December 31, 2012 Compared with the Year Ended December 31, 2011
Unless otherwise stated, all amounts discussed below are net of income tax.
Operating earnings available to common shareholders and operating earnings each decreased $85 million, primarily due to lower net investment
income, higher expenses and lower earnings on invested assets that were funded using the FHLB advances. These decreases were partially offset
by lower interest expense on debt and higher tax credits.
In 2012, the Company incurred $103 million of employee-related costs associated with its enterprise-wide strategic initiative. In the first quarterof
2012, the Company also incurred a $26 million charge representing a multi-state examination payment related to unclaimed property and MetLife’s
use of the U.S. Social Security Administration’s Death Master File. In addition, advertising costs were $10 million higher compared to 2011. Partially
offsetting these charges were $40 million of expenses incurred in 2011 related to the liquidation plan filed by the Department of Financial Services for
ELNY. In addition, 2012 results included $15 million of lower rent expense and $12 million of lower internal resource costs for associates committed
to the ALICO Acquisition.
38 MetLife, Inc.