MetLife 2013 Annual Report Download - page 23
Download and view the complete annual report
Please find page 23 of the 2013 MetLife annual report below. You can navigate through the pages in the report by either clicking on the pages listed below, or by using the keyword search tool below to find specific information within the annual report.-
 1
1 -
2
-
3
-
4
-
5
-
6
-
7
-
8
-
9
-
10
-
11
-
12
-
 13
13 -
 14
14 -
 15
15 -
 16
16 -
 17
17 -
 18
18 -
 19
19 -
 20
20 -
 21
21 -
 22
22 -
 23
23 -
 24
24 -
 25
25 -
 26
26 -
 27
27 -
 28
28 -
 29
29 -
 30
30 -
 31
31 -
 32
32 -
 33
33 -
34
-
35
-
36
-
37
-
38
-
39
-
40
-
41
-
42
-
43
-
44
-
45
-
46
-
47
-
48
-
49
-
50
-
51
-
52
-
53
-
54
-
55
-
56
-
57
-
58
-
59
-
60
-
61
-
62
-
63
-
64
-
65
-
66
-
67
-
68
-
69
-
70
-
71
-
72
-
73
-
74
-
75
-
76
-
77
-
78
-
79
-
80
-
81
-
82
-
83
-
84
-
85
-
86
-
87
-
88
-
89
-
90
-
91
-
92
-
93
-
94
-
95
-
96
-
97
-
98
-
99
-
100
-
101
-
102
-
103
-
104
-
105
-
106
-
107
-
108
-
109
-
110
-
111
-
112
-
113
-
114
-
115
-
116
-
117
-
118
-
119
-
120
-
121
-
122
-
123
-
124
-
125
-
126
-
127
-
128
-
129
-
130
-
131
-
132
-
133
-
134
-
135
-
136
-
137
-
138
-
139
-
140
-
141
-
142
-
143
-
144
-
145
-
146
-
147
-
148
-
149
-
150
-
151
-
152
-
153
-
154
-
155
-
156
-
157
-
158
-
159
-
160
-
161
-
162
-
163
-
164
-
165
-
166
-
167
-
168
-
169
-
170
-
171
-
172
-
173
-
174
-
175
-
176
-
177
-
178
-
179
-
180
-
181
-
182
-
183
-
184
-
185
-
186
-
187
-
188
-
189
-
190
-
191
-
192
-
193
-
194
-
195
-
196
-
197
-
198
-
199
-
200
-
201
-
202
-
203
-
204
-
205
-
206
-
207
-
208
-
209
-
210
-
211
-
212
-
213
-
214
-
215
-
216
-
217
-
218
-
219
-
220
-
221
-
222
-
223
-
224
 |
 |

with a long-term separate account return after the five-year reversion period is over. The current long-term rate of return assumption for the variable
universal life contracts and variable deferred annuity contracts is 7.25% for the U.S.
We also periodically review other long-term assumptions underlying the projections of estimated gross margins and profits. These assumptions
primarily relate to investment returns, policyholder dividend scales, interest crediting rates, mortality, persistency, and expenses to administer business.
Assumptions used in the calculation of estimated gross margins and profits which may have significantly changed are updated annually. If the update of
assumptions causes expected future gross margins and profits to increase, DAC and VOBA amortization will decrease, resulting in a current period
increase to earnings. The opposite result occurs when the assumption update causes expected future gross margins and profits to decrease.
Our most significant assumption updates resulting in a change to expected future gross margins and profits and the amortization of DAC and VOBA
are due to revisions to expected future investment returns, expenses, in-force or persistency assumptions and policyholder dividends on participating
traditional life contracts, variable and universal life contracts and annuity contracts. We expect these assumptions to be the ones most reasonably likely
to cause significant changes in the future. Changes in these assumptions can be offsetting and we are unable to predict their movement or offsetting
impact over time.
At December 31, 2013, 2012 and 2011, DAC and VOBA for the Company was $26.7 billion, $24.8 billion and $24.6 billion, respectively.
Amortization of DAC and VOBA associated with the variable and universal life and the annuity contracts was significantly impacted by movements in
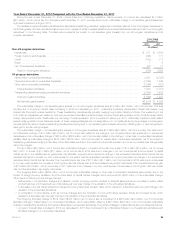
equity markets. The following illustrates the effect on DAC and VOBA of changing each of the respective assumptions, as well as updating estimated
gross margins or profits with actual gross margins or profits during the years ended December 31, 2013, 2012 and 2011. Increases (decreases) in
DAC and VOBA balances, as presented below, resulted in a corresponding decrease (increase) in amortization.
Years Ended December 31,
2013 2012 2011
(In millions)
Investment return .................................................................. $(66) $(161) $ (43)
Separate account balances .......................................................... 157 39 (125)
Net investment gain (loss) ........................................................... 195 (44) (530)
Guaranteed minimum income benefits ................................................. 337 23 (13)
Expense ......................................................................... 36 10 (6)
In-force/Persistency ................................................................ 72 368 (6)
Policyholder dividends and other ...................................................... 8 (4) 32
Total .......................................................................... $739 $ 231 $(691)
The following represents significant items contributing to the changes to DAC and VOBA amortization in 2013:
‰The increase in equity markets during the year increased separate account balances, which led to higher actual and expected future gross profits
on variable universal life contracts and variable deferred annuity contracts resulting in a decrease of $157 million in DAC and VOBA amortization.
‰Changes in net investment gains (losses) resulted in the following changes in DAC and VOBA amortization:
– Actual gross profits increased as a result of a decrease in liabilities associated with guarantee obligations on variable annuities, resulting in an
increase of DAC and VOBA amortization of $1.1 billion, excluding the impact from our nonperformance risk and risk margins, which are
described below. This increase in actual gross profits was more than offset by freestanding derivative losses associated with the hedging of
such guarantee obligations, which resulted in a decrease in DAC and VOBA amortization of $1.2 billion.
– The tightening of our nonperformance risk adjustment increased the valuation of guarantee liabilities, decreased actual gross profits and
decreased DAC and VOBA amortization by $94 million. This was partially offset by lower risk margins, which decreased the guarantee liability
valuations, increased actual gross profits and increased DAC and VOBA amortization by $60 million.
– The remainder of the impact of net investment gains (losses), which decreased DAC and VOBA amortization by $72 million, was primarily
attributable to 2013 investment activities.
‰The hedging and reinsurance losses associated with the insurance liabilities of the guaranteed minimum income benefits (“GMIBs”) decreased
actual gross profits and decreased DAC and VOBA amortization by $349 million.
The following represents significant items contributing to the changes to DAC and VOBA amortization in 2012:
‰The increase in actual, as well as changes in projected, investment returns resulted in an increase in actual and a reduction in expected future
gross profits on variable universal life contracts and variable deferred annuity contracts resulting in an increase of $161 million in DAC and VOBA
amortization.
‰Better than expected persistency and changes in assumptions regarding persistency, especially in the U.S. deferred variable annuity contracts,
resulted in an increase in actual and expected future gross profits resulting in a decrease of $368 million in DAC and VOBA amortization.
The following represents significant items contributing to the changes to DAC and VOBA amortization in 2011:
‰The decrease in equity markets during the year lowered separate account balances, which led to a reduction in actual and expected future gross
profits on variable universal life contracts and variable deferred annuity contracts resulting in an increase of $125 million in DAC and VOBA
amortization.
‰Changes in net investment gains (losses) resulted in the following changes in DAC and VOBA amortization:
– Actual gross profits decreased as a result of an increase in liabilities associated with guarantee obligations on variable annuities, resulting in a
decrease of DAC and VOBA amortization of $478 million, excluding the impact from our nonperformance risk and risk margins, which are
described below. This decrease in actual gross profits was more than offset by freestanding derivative gains associated with the hedging of
such guarantee obligations, which resulted in an increase in DAC and VOBA amortization of $759 million.
– The widening of our nonperformance risk adjustment decreased the valuation of guarantee liabilities, increased actual gross profits and
increased DAC and VOBA amortization by $234 million. This was partially offset by higher risk margins, which increased the guarantee liability
valuations, decreased actual gross profits and decreased DAC and VOBA amortization by $64 million.
– The remainder of the impact of net investment gains (losses), which increased DAC and VOBA amortization by $79 million, was primarily
attributable to 2011 investment activities.
MetLife, Inc. 15