MetLife 2013 Annual Report Download - page 33
Download and view the complete annual report
Please find page 33 of the 2013 MetLife annual report below. You can navigate through the pages in the report by either clicking on the pages listed below, or by using the keyword search tool below to find specific information within the annual report.-
 1
1 -
2
-
3
-
4
-
5
-
6
-
7
-
8
-
9
-
10
-
11
-
12
-
13
-
14
-
15
-
16
-
17
-
18
-
19
-
20
-
21
-
22
-
 23
23 -
 24
24 -
 25
25 -
 26
26 -
 27
27 -
 28
28 -
 29
29 -
 30
30 -
 31
31 -
 32
32 -
 33
33 -
 34
34 -
 35
35 -
 36
36 -
 37
37 -
 38
38 -
 39
39 -
 40
40 -
 41
41 -
 42
42 -
 43
43 -
44
-
45
-
46
-
47
-
48
-
49
-
50
-
51
-
52
-
53
-
54
-
55
-
56
-
57
-
58
-
59
-
60
-
61
-
62
-
63
-
64
-
65
-
66
-
67
-
68
-
69
-
70
-
71
-
72
-
73
-
74
-
75
-
76
-
77
-
78
-
79
-
80
-
81
-
82
-
83
-
84
-
85
-
86
-
87
-
88
-
89
-
90
-
91
-
92
-
93
-
94
-
95
-
96
-
97
-
98
-
99
-
100
-
101
-
102
-
103
-
104
-
105
-
106
-
107
-
108
-
109
-
110
-
111
-
112
-
113
-
114
-
115
-
116
-
117
-
118
-
119
-
120
-
121
-
122
-
123
-
124
-
125
-
126
-
127
-
128
-
129
-
130
-
131
-
132
-
133
-
134
-
135
-
136
-
137
-
138
-
139
-
140
-
141
-
142
-
143
-
144
-
145
-
146
-
147
-
148
-
149
-
150
-
151
-
152
-
153
-
154
-
155
-
156
-
157
-
158
-
159
-
160
-
161
-
162
-
163
-
164
-
165
-
166
-
167
-
168
-
169
-
170
-
171
-
172
-
173
-
174
-
175
-
176
-
177
-
178
-
179
-
180
-
181
-
182
-
183
-
184
-
185
-
186
-
187
-
188
-
189
-
190
-
191
-
192
-
193
-
194
-
195
-
196
-
197
-
198
-
199
-
200
-
201
-
202
-
203
-
204
-
205
-
206
-
207
-
208
-
209
-
210
-
211
-
212
-
213
-
214
-
215
-
216
-
217
-
218
-
219
-
220
-
221
-
222
-
223
-
224
 |
 |

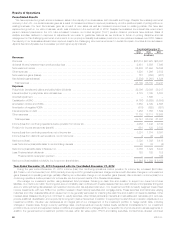
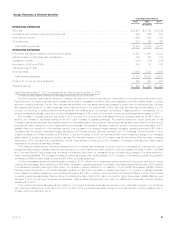
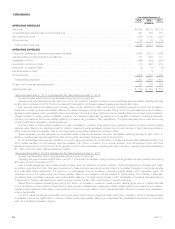
Reconciliation of income (loss) from continuing operations, net of income tax, to operating earnings available to common
shareholders
Year Ended December 31, 2013
Retail
Group,
Voluntary
& Worksite
Benefits
Corporate
Benefit
Funding Latin
America Asia EMEA Corporate
& Other Total
(In millions)
Income (loss) from continuing operations, net of income tax . . . $1,498 $ 397 $ 1,178 $666 $ 582 $ 349 $(1,279) $ 3,391
Less: Net investment gains (losses) ...................... 70 (21) (8) 20 343 (16) (227) 161
Less: Net derivative gains (losses) ....................... (724) (676) (235) (24) (1,057) (6) (517) (3,239)
Less: Goodwill impairment ............................. – – – – – – – –
Less:Otheradjustmentstocontinuingoperations(1) ......... (926) (172) 46 167 (435) 75 (393) (1,638)
Less: Provision for income tax (expense) benefit ............ 554 304 68 (71) 487 (33) 389 1,698
Operating earnings .................................. $2,524 $ 962 $ 1,307 $574 $ 1,244 $ 329 (531) 6,409
Less: Preferred stock dividends ......................... 122 122
Operating earnings available to common shareholders ....... $ (653) $ 6,287
Year Ended December 31, 2012
Retail
Group,
Voluntary
& Worksite
Benefits
Corporate
Benefit
Funding Latin
America Asia EMEA Corporate
& Other Total
(In millions)
Income (loss) from continuing operations, net of income tax .... $ (44) $ 824 $1,204 $ 479 $ 976 $293 $(2,418) $ 1,314
Less: Net investment gains (losses) ....................... 212 (7) 107 (2) (342) 31 (351) (352)
Less: Net derivative gains (losses) ........................ 162 (63) (157) 38 (170) 61 (1,790) (1,919)
Less: Goodwill impairment .............................. (1,692) – – – – – (176) (1,868)
Less:Otheradjustmentstocontinuingoperations(1) .......... (1,260) (141) 19 (193) (32) (22) (921) (2,550)
Less: Provision for income tax (expense) benefit ............. 532 75 11 53 483 (48) 1,089 2,195
Operating earnings .................................... $2,002 $ 960 $1,224 $ 583 $1,037 $271 (269) 5,808
Less: Preferred stock dividends .......................... 122 122
Operating earnings available to common shareholders ........ $ (391) $ 5,686
Year Ended December 31, 2011
Retail
Group,
Voluntary
& Worksite
Benefits
Corporate
Benefit
Funding Latin
America Asia EMEA Corporate
& Other Total
(In millions)
Income (loss) from continuing operations, net of income tax ..... $2,486 $1,568 $1,454 $ 214 $ 835 $(153) $ (13) $ 6,391
Less: Net investment gains (losses) ........................ 158 (26) 19 (6) (305) (525) (182) (867)
Less: Net derivative gains (losses) ......................... 2,321 1,203 426 (36) 202 32 676 4,824
Less: Goodwill impairment ............................... – – – – – – – –
Less: Other adjustments to continuing operations (1) ........... (709) (137) 79 (340) 14 (75) (283) (1,451)
Less: Provision for income tax (expense) benefit .............. (619) (363) (182) 82 44 164 (40) (914)
Operating earnings ..................................... $1,335 $ 891 $1,112 $ 514 $ 880 $ 251 (184) 4,799
Less: Preferred stock dividends ........................... 122 122
Operating earnings available to common shareholders ......... $(306) $ 4,677
(1) See definitions of operating revenues and operating expenses under “— Non-GAAP and Other Financial Disclosures” for the components of such
adjustments.
MetLife, Inc. 25