MetLife 2013 Annual Report Download - page 57
Download and view the complete annual report
Please find page 57 of the 2013 MetLife annual report below. You can navigate through the pages in the report by either clicking on the pages listed below, or by using the keyword search tool below to find specific information within the annual report.-
 1
1 -
2
-
3
-
4
-
5
-
6
-
7
-
8
-
9
-
10
-
11
-
12
-
13
-
14
-
15
-
16
-
17
-
18
-
19
-
20
-
21
-
22
-
23
-
24
-
25
-
26
-
27
-
28
-
29
-
30
-
31
-
32
-
33
-
34
-
35
-
36
-
37
-
38
-
39
-
40
-
41
-
42
-
43
-
44
-
45
-
46
-
 47
47 -
 48
48 -
 49
49 -
 50
50 -
 51
51 -
 52
52 -
 53
53 -
 54
54 -
 55
55 -
 56
56 -
 57
57 -
 58
58 -
 59
59 -
 60
60 -
 61
61 -
 62
62 -
 63
63 -
 64
64 -
 65
65 -
 66
66 -
 67
67 -
68
-
69
-
70
-
71
-
72
-
73
-
74
-
75
-
76
-
77
-
78
-
79
-
80
-
81
-
82
-
83
-
84
-
85
-
86
-
87
-
88
-
89
-
90
-
91
-
92
-
93
-
94
-
95
-
96
-
97
-
98
-
99
-
100
-
101
-
102
-
103
-
104
-
105
-
106
-
107
-
108
-
109
-
110
-
111
-
112
-
113
-
114
-
115
-
116
-
117
-
118
-
119
-
120
-
121
-
122
-
123
-
124
-
125
-
126
-
127
-
128
-
129
-
130
-
131
-
132
-
133
-
134
-
135
-
136
-
137
-
138
-
139
-
140
-
141
-
142
-
143
-
144
-
145
-
146
-
147
-
148
-
149
-
150
-
151
-
152
-
153
-
154
-
155
-
156
-
157
-
158
-
159
-
160
-
161
-
162
-
163
-
164
-
165
-
166
-
167
-
168
-
169
-
170
-
171
-
172
-
173
-
174
-
175
-
176
-
177
-
178
-
179
-
180
-
181
-
182
-
183
-
184
-
185
-
186
-
187
-
188
-
189
-
190
-
191
-
192
-
193
-
194
-
195
-
196
-
197
-
198
-
199
-
200
-
201
-
202
-
203
-
204
-
205
-
206
-
207
-
208
-
209
-
210
-
211
-
212
-
213
-
214
-
215
-
216
-
217
-
218
-
219
-
220
-
221
-
222
-
223
-
224
 |
 |

Securities Lending
We participate in a securities lending program whereby securities are loaned to third parties, primarily brokerage firms and commercial banks. We
obtain collateral, usually cash, in an amount generally equal to 102% of the estimated fair value of the securities loaned, which is obtained at the
inception of a loan and maintained at a level greater than or equal to 100% for the duration of the loan. Securities loaned under such transactions may
be sold or repledged by the transferee. We are liable to return to our counterparties the cash collateral under our control. These transactions are treated
as financing arrangements and the associated cash collateral liability is recorded at the amount of the cash received.
See “— Liquidity and Capital Resources — The Company — Liquidity and Capital Uses — Securities Lending” and Note 8 of the Notes to the
Consolidated Financial Statements for financial information regarding our securities lending program.
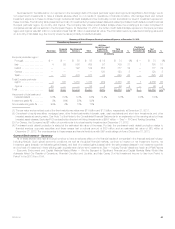
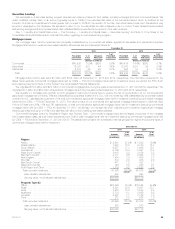
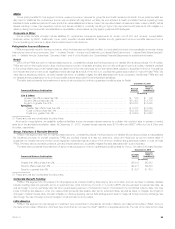
Mortgage Loans
Our mortgage loans held-for-investment are principally collateralized by commercial real estate, agricultural real estate and residential properties.
Mortgage loans held-for-investment and related valuation allowances are summarized as follows at:
December 31,
2013 2012
Recorded
Investment %of
Total Valuation
Allowance
%of
Recorded
Investment Recorded
Investment %of
Total Valuation
Allowance
%of
Recorded
Investment
(Dollars in millions) (Dollars in millions)
Commercial ................................... $40,926 73.0% $258 0.6% $40,472 74.6% $293 0.7%
Agricultural .................................... 12,391 22.1 44 0.4% 12,843 23.6 52 0.4%
Residential .................................... 2,772 4.9 20 0.7% 958 1.8 2 0.2%
Total ....................................... $56,089 100.0% $322 0.6% $54,273 100.0% $347 0.6%
Mortgage loans held-for-sale were $3 million and $414 million at December 31, 2013 and 2012, respectively. The information presented in the
tables herein exclude commercial mortgage loans held by CSEs — FVO and mortgage loans held-for-investment where we elected the FVO. Such
amounts are presented in Note 8 of the Notes to the Consolidated Financial Statements.
We originated $10.5 billion and $9.6 billion of commercial mortgage loans during the years ended December 31, 2013 and 2012, respectively. We
originated $3.3 billion and $3.0 billion of agricultural mortgage loans during the years ended December 31, 2013 and 2012, respectively.
We diversify our mortgage loan portfolio by both geographic region and property type to reduce the risk of concentration. Of our commercial and
agricultural mortgage loan portfolios, 86% are collateralized by properties located in the U.S., with the remaining 14% collateralized by properties located
outside the U.S., calculated as a percent of the total commercial and agricultural mortgage loans held-for-investment (excluding commercial mortgage
loans held by CSEs — FVO) at December 31, 2013. The carrying value of our commercial and agricultural mortgage loans located in California, New
York and Texas were 20%, 11% and 7%, respectively, of total commercial and agricultural mortgage loans held-for-investment (excluding commercial
mortgage loans held by CSEs — FVO) at December 31, 2013. Additionally, we manage risk when originating commercial and agricultural mortgage
loans by generally lending up to 75% of the estimated fair value of the underlying real estate collateral.
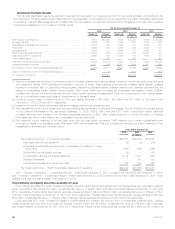
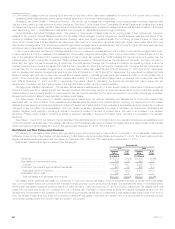
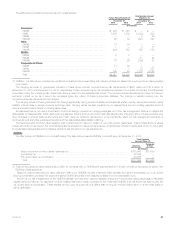
Commercial Mortgage Loans by Geographic Region and Property Type. Commercial mortgage loans are the largest component of the mortgage
loan invested asset class, as such loans represented over 70% of total mortgage loans held-for-investment (excluding commercial mortgage loans held
by CSEs — FVO) at both December 31, 2013 and 2012. The tables below present the diversification across geographic regions and property types of
commercial mortgage loans held-for-investment:
December 31,
2013 2012
Amount %of
Total Amount %of
Total
(In millions) (In millions)
Region:
Pacific ............................................................. $ 8,961 21.9% $ 7,932 19.6%
Middle Atlantic ....................................................... 7,367 18.0 6,780 16.7
South Atlantic ....................................................... 6,977 17.1 7,969 19.7
International ......................................................... 6,709 16.4 5,567 13.8
West South Central ................................................... 3,619 8.8 3,436 8.5
East North Central .................................................... 2,717 6.6 3,026 7.5
New England ........................................................ 1,404 3.4 1,489 3.7
Mountain ........................................................... 834 2.0 906 2.2
East South Central .................................................... 471 1.2 457 1.1
West North Central ................................................... 148 0.4 288 0.7
Multi-Region and Other ................................................ 1,719 4.2 2,622 6.5
Total recorded investment ............................................. 40,926 100.0% 40,472 100.0%
Less: valuation allowances ........................................... 258 293
Carrying value, net of valuation allowances ............................... $40,668 $40,179
Property Type:(1)
Office .............................................................. $20,629 50.4% $19,524 48.2%
Retail .............................................................. 9,245 22.6 9,601 23.7
Hotel .............................................................. 4,219 10.3 3,555 8.8
Apartment .......................................................... 3,724 9.1 3,999 9.9
Industrial ........................................................... 2,897 7.1 3,159 7.8
Other .............................................................. 212 0.5 634 1.6
Total recorded investment ............................................. 40,926 100.0% 40,472 100.0%
Less: valuation allowances ........................................... 258 293
Carrying value, net of valuation allowances ............................... $40,668 $40,179
MetLife, Inc. 49