MetLife 2013 Annual Report Download - page 30
Download and view the complete annual report
Please find page 30 of the 2013 MetLife annual report below. You can navigate through the pages in the report by either clicking on the pages listed below, or by using the keyword search tool below to find specific information within the annual report.When equity index levels decrease in isolation, the variable annuity guarantees become more valuable to policyholders, which results in an increase
in the undiscounted embedded derivative liability. Discounting this unfavorable change by the risk adjusted rate yields a smaller loss than by
discounting at the risk free rate, thus creating a gain from including an adjustment for nonperformance risk.
When the risk free interest rate decreases in isolation, discounting the embedded derivative liability produces a higher valuation of the liability than if
the risk free interest rate had remained constant. Discounting this unfavorable change by the risk adjusted rate yields a smaller loss than by
discounting at the risk free rate, thus creating a gain from including an adjustment for nonperformance risk.
When our own credit spread increases in isolation, discounting the embedded derivative liability produces a lower valuation of the liability than if our
own credit spread had remained constant. As a result, a gain is created from including an adjustment for nonperformance risk. For each of these
primary market drivers, the opposite effect occurs when they move in the opposite direction.
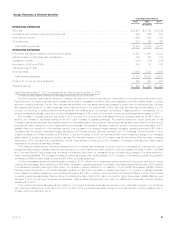
The foregoing $1.2 billion ($763 million, net of income tax) favorable change in other risks in embedded derivatives was primarily due to the cross
effect of capital markets changes and refinements in the attribution analysis and valuation model, including periodic updates to actuarial assumptions
and updates to better reflect product features, which accounted for $961 million of this favorable change. Other items contributing to this change
included:
‰A decrease in the risk margin adjustment caused by lower policyholder behavior risks, which resulted in a favorable year over year change in the
valuation of the embedded derivatives.
‰The mismatch of fund performance between actual and modeled funds and periodic updates to the mapping of policyholder funds into groups of
representative indices, which resulted in a favorable year over year change in the valuation of the embedded derivatives.
‰A combination of other factors, such as in-force changes, resulted in an unfavorable year over year change in the valuation of the embedded
derivatives.
The foregoing $937 million ($609 million, net of income tax) unfavorable change is comprised of a $2.7 billion ($1.8 billion, net of income tax)
unfavorable change in freestanding derivatives that hedge market risks in embedded derivatives, which was partially offset by a $1.8 billion
($1.2 billion, net of income tax) favorable change in market risks in embedded derivatives.
The primary changes in market factors are summarized as follows:
‰Long-term interest rates increased more in 2013 than in 2012, contributing to an unfavorable change in our freestanding derivatives and a
favorable change in our embedded derivatives.
‰Key equity index levels increased more in 2013 than in 2012 contributing to an unfavorable change in our freestanding derivatives and a favorable
change in our embedded derivatives.
‰Key equity volatility measures decreased less in 2013 than in 2012, contributing to a favorable change in our freestanding derivatives and an
unfavorable change in our embedded derivatives.
‰Changes in foreign currency exchange rates contributed to an unfavorable change in our freestanding derivatives and a favorable change in our
embedded derivatives.
The favorable change in net investment gains (losses) primarily reflects an increase in net gains on sales of fixed maturity securities in 2013
coupled with a decrease in fixed maturity securities impairments from lower intent-to-sell impairments and improving economic fundamentals.
During our 2013 goodwill impairment testing, we determined that goodwill was not impaired. In 2012, we recorded a $1.9 billion ($1.6 billion, net of
income tax) non-cash charge for goodwill impairment associated with our U.S. Retail annuities business.
Our 2013 results include a $101 million ($69 million, net of income tax) charge associated with the global review of assumptions related to
reserves and DAC, of which $138 million ($90 million, net of income tax) was recognized in net derivative gains (losses). Of the $101 million charge,
$228 million ($150 million, net of income tax) was related to reserves, offset by $127 million ($81 million, net of income tax) associated with DAC.
The foregoing $138 million loss recorded in net derivative gains (losses) associated with the global review of assumptions was included within the
other risks in embedded derivatives caption in the table above.
As a result of the global review of assumptions, changes were made to policyholder behavior and mortality assumptions, as well as to economic
assumptions. The most significant impacts were in Retail Annuities.
‰Changes to policyholder behavior and mortality assumptions resulted in reserve increases, offset by favorable DAC, for a net loss of $154 million
($103 million, net of income tax).
‰Changes in economic assumptions resulted in a decrease in reserves, offset by unfavorable DAC, for a net benefit of $53 million ($34 million,
net of income tax).
Income (loss) from continuing operations, before provision for income tax, related to the Divested Businesses, excluding net investment gains
(losses) and net derivative gains (losses) increased $459 million to a loss of $200 million in 2013 from a loss of $659 million in 2012. Included in this
improvement was a decrease in total revenues of $517 million, before income tax, and a decrease in total expenses of $976 million, before income
tax. The Divested Businesses include certain operations of MetLife Bank and the Caribbean region, Panama and Costa Rica.
Income tax expense for the year ended December 31, 2013 was $661 million, or 16% of income (loss) from continuing operations before income
tax, compared with $128 million, or 9% of income (loss) from continuing operations before income tax, for 2012. The Company’s 2013 effective tax
rate differs from the U.S. statutory rate of 35% primarily due to non-taxable investment income, tax credits for investments in low income housing, and
foreign earnings taxed at lower rates than the U.S. statutory rate. Foreign earnings include one-time tax benefits of $119 million related to the receipt of
a Japan tax refund, $69 million related to the estimated reversal of Japan temporary differences, and $65 million related to the change in repatriation
assumptions for foreign earnings of certain European operations. The Company’s 2012 effective tax rate differs from the U.S. statutory rate of 35%
primarily due to non-taxable investment income, tax credits for investments in low income housing, and foreign earnings taxed at lower rates than the
U.S. statutory rate. In addition, as previously mentioned, the year ended December 31, 2012 included a $1.9 billion ($1.6 billion, net of income tax)
non-cash charge for goodwill impairment. The tax benefit associated with this charge was limited to $247 million on the associated tax goodwill.
As more fully described in “— Non-GAAP and Other Financial Disclosures,” we use operating earnings, which does not equate to income (loss)
from continuing operations, net of income tax, as determined in accordance with GAAP, to analyze our performance, evaluate segment performance,
and allocate resources. We believe that the presentation of operating earnings and operating earnings available to common shareholders, as we
measure it for management purposes, enhances the understanding of our performance by highlighting the results of operations and the underlying
profitability drivers of the business. Operating earnings and operating earnings available to common shareholders should not be viewed as substitutes
for income (loss) from continuing operations, net of income tax, and net income (loss) available to MetLife, Inc.’s common shareholders, respectively.
Operating earnings available to common shareholders increased $601 million, net of income tax, to $6.3 billion, net of income tax, for the year ended
December 31, 2013 from $5.7 billion, net of income tax, in 2012.
22 MetLife, Inc.


