MetLife 2013 Annual Report Download - page 42
Download and view the complete annual report
Please find page 42 of the 2013 MetLife annual report below. You can navigate through the pages in the report by either clicking on the pages listed below, or by using the keyword search tool below to find specific information within the annual report.-
 1
1 -
2
-
3
-
4
-
5
-
6
-
7
-
8
-
9
-
10
-
11
-
12
-
13
-
14
-
15
-
16
-
17
-
18
-
19
-
20
-
21
-
22
-
23
-
24
-
25
-
26
-
27
-
28
-
29
-
30
-
31
-
 32
32 -
 33
33 -
 34
34 -
 35
35 -
 36
36 -
 37
37 -
 38
38 -
 39
39 -
 40
40 -
 41
41 -
 42
42 -
 43
43 -
 44
44 -
 45
45 -
 46
46 -
 47
47 -
 48
48 -
 49
49 -
 50
50 -
 51
51 -
 52
52 -
53
-
54
-
55
-
56
-
57
-
58
-
59
-
60
-
61
-
62
-
63
-
64
-
65
-
66
-
67
-
68
-
69
-
70
-
71
-
72
-
73
-
74
-
75
-
76
-
77
-
78
-
79
-
80
-
81
-
82
-
83
-
84
-
85
-
86
-
87
-
88
-
89
-
90
-
91
-
92
-
93
-
94
-
95
-
96
-
97
-
98
-
99
-
100
-
101
-
102
-
103
-
104
-
105
-
106
-
107
-
108
-
109
-
110
-
111
-
112
-
113
-
114
-
115
-
116
-
117
-
118
-
119
-
120
-
121
-
122
-
123
-
124
-
125
-
126
-
127
-
128
-
129
-
130
-
131
-
132
-
133
-
134
-
135
-
136
-
137
-
138
-
139
-
140
-
141
-
142
-
143
-
144
-
145
-
146
-
147
-
148
-
149
-
150
-
151
-
152
-
153
-
154
-
155
-
156
-
157
-
158
-
159
-
160
-
161
-
162
-
163
-
164
-
165
-
166
-
167
-
168
-
169
-
170
-
171
-
172
-
173
-
174
-
175
-
176
-
177
-
178
-
179
-
180
-
181
-
182
-
183
-
184
-
185
-
186
-
187
-
188
-
189
-
190
-
191
-
192
-
193
-
194
-
195
-
196
-
197
-
198
-
199
-
200
-
201
-
202
-
203
-
204
-
205
-
206
-
207
-
208
-
209
-
210
-
211
-
212
-
213
-
214
-
215
-
216
-
217
-
218
-
219
-
220
-
221
-
222
-
223
-
224
 |
 |

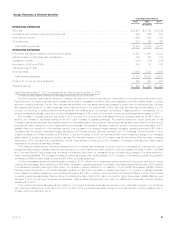
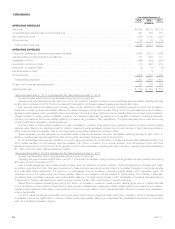
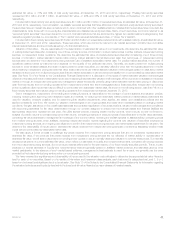
Latin America
Years Ended December 31,
2013 2012 2011
(In millions)
OPERATING REVENUES
Premiums ....................................................................................... $2,824 $2,578 $2,514
Universal life and investment-type product policy fees ..................................................... 991 785 757
Net investment income ............................................................................. 1,246 1,198 1,025
Other revenues ................................................................................... 23 16 15
Total operating revenues .......................................................................... 5,084 4,577 4,311
OPERATING EXPENSES
Policyholder benefits and claims and policyholder dividends ................................................ 2,454 2,231 2,064
Interest credited to policyholder account balances ........................................................ 417 393 371
Capitalization of DAC .............................................................................. (424) (353) (295)
Amortization of DAC and VOBA ...................................................................... 310 224 207
Amortization of negative VOBA ....................................................................... (2) (5) (6)
Interest expense on debt ........................................................................... — (1) 1
Other expenses .................................................................................. 1,612 1,375 1,305
Total operating expenses ......................................................................... 4,367 3,864 3,647
Provision for income tax expense (benefit) .............................................................. 143 130 150
Operating earnings ................................................................................ $ 574 $ 583 $ 514
Year Ended December 31, 2013 Compared with the Year Ended December 31, 2012
Unless otherwise stated, all amounts discussed below are net of income tax.
Operating earnings decreased by $9 million from 2012. The impact of changes in foreign currency exchange rates decreased operating earnings
by $10 million compared to 2012. The fourth quarter 2013 acquisition of ProVida increased operating earnings by $48 million.
Latin America experienced sales growth primarily driven by life, accident & health, and annuity products in several countries. The increase in
premiums for these products was partially offset by the related changes in policyholder benefits. The growth in our businesses drove an increase in
average invested assets, which generated higher net investment income and higher policy fee income, partially offset by a corresponding increase in
interest credited on certain insurance liabilities. However, the increase in sales also generated a more significant increase in operating expenses,
including commissions, which were partially offset by a corresponding increase in DAC capitalization. The items discussed above were the primary
drivers of a $2 million decrease in operating earnings.
The net impact of market factors resulted in a slight decrease in operating earnings as lower investment yields and higher interest credited
expense were offset by the favorable impact of inflation. Investment yields decreased primarily due to lower returns on fixed maturity securities in
Brazil, Chile and Argentina, partially offset by improved yields on alternative investments, primarily in Chile.
Higher expenses, primarily generated by employee-related costs across several countries, decreased operating earnings by $30 million. In
addition, operating earnings decreased $18 million due to certain tax-related charges in both 2013 and 2012.
On an annual basis, we review and update our long-term assumptions used in the calculation of certain insurance-related liabilities and DAC. The
2013 update resulted in a net operating earnings increase of $7 million. In addition to our annual updates, other refinements to DAC and other
adjustments recorded in both 2013 and 2012 resulted in a $14 million decrease in operating earnings. In addition, operating earnings increased by
$11 million due to favorable claims experience in Mexico.
Year Ended December 31, 2012 Compared with the Year Ended December 31, 2011
Unless otherwise stated, all amounts discussed below are net of income tax.
Operating earnings increased by $69 million over 2011. The impact of changes in foreign currency exchange rates reduced operating earnings by
$30 million for 2012 compared to 2011.
Latin America experienced strong sales growth primarily driven by retirement products in Mexico, Chile and Brazil and by accident and health
products in Argentina and Chile. Changes in premiums for these products were almost entirely offset by the related changes in policyholder benefits
and unfavorable claims experience. The growth in our businesses drove an increase in average invested assets, which generated higher net
investment income and higher policy fee income, partially offset by an increase in interest credited to policyholders. The increase in sales also
generated higher commission expense, which was partially offset by a corresponding increase in DAC capitalization. The items discussed above,
coupled with a change in allocated equity, were the primary drivers of a $41 million improvement in operating earnings.
Market factors increased operating earnings by $15 million. An increase in investment yields primarily reflects higher returns on fixed maturities
from a repositioning of the portfolio in Argentina and higher returns on variable rate investments in Brazil, partially offset by a corresponding increase in
interest credited expense. A decrease in net investment income from lower inflation in 2011 was substantially offset by a corresponding decrease in
policyholder benefits.
Our 2012 results include various favorable income tax items of $38 million in Argentina, Mexico and Chile. In addition, the 2012 results benefited
from liability refinements of $22 million in Chile and Mexico which were partially offset by an unfavorable DAC capitalization adjustment in Chile anda
write-off of capitalized software in Mexico.
34 MetLife, Inc.