MetLife 2013 Annual Report Download - page 135
Download and view the complete annual report
Please find page 135 of the 2013 MetLife annual report below. You can navigate through the pages in the report by either clicking on the pages listed below, or by using the keyword search tool below to find specific information within the annual report.-
 1
1 -
2
-
3
-
4
-
5
-
6
-
7
-
8
-
9
-
10
-
11
-
12
-
13
-
14
-
15
-
16
-
17
-
18
-
19
-
20
-
21
-
22
-
23
-
24
-
25
-
26
-
27
-
28
-
29
-
30
-
31
-
32
-
33
-
34
-
35
-
36
-
37
-
38
-
39
-
40
-
41
-
42
-
43
-
44
-
45
-
46
-
47
-
48
-
49
-
50
-
51
-
52
-
53
-
54
-
55
-
56
-
57
-
58
-
59
-
60
-
61
-
62
-
63
-
64
-
65
-
66
-
67
-
68
-
69
-
70
-
71
-
72
-
73
-
74
-
75
-
76
-
77
-
78
-
79
-
80
-
81
-
82
-
83
-
84
-
85
-
86
-
87
-
88
-
89
-
90
-
91
-
92
-
93
-
94
-
95
-
96
-
97
-
98
-
99
-
100
-
101
-
102
-
103
-
104
-
105
-
106
-
107
-
108
-
109
-
110
-
111
-
112
-
113
-
114
-
115
-
116
-
117
-
118
-
119
-
120
-
121
-
122
-
123
-
124
-
 125
125 -
 126
126 -
 127
127 -
 128
128 -
 129
129 -
 130
130 -
 131
131 -
 132
132 -
 133
133 -
 134
134 -
 135
135 -
 136
136 -
 137
137 -
 138
138 -
 139
139 -
 140
140 -
 141
141 -
 142
142 -
 143
143 -
 144
144 -
 145
145 -
146
-
147
-
148
-
149
-
150
-
151
-
152
-
153
-
154
-
155
-
156
-
157
-
158
-
159
-
160
-
161
-
162
-
163
-
164
-
165
-
166
-
167
-
168
-
169
-
170
-
171
-
172
-
173
-
174
-
175
-
176
-
177
-
178
-
179
-
180
-
181
-
182
-
183
-
184
-
185
-
186
-
187
-
188
-
189
-
190
-
191
-
192
-
193
-
194
-
195
-
196
-
197
-
198
-
199
-
200
-
201
-
202
-
203
-
204
-
205
-
206
-
207
-
208
-
209
-
210
-
211
-
212
-
213
-
214
-
215
-
216
-
217
-
218
-
219
-
220
-
221
-
222
-
223
-
224
 |
 |

MetLife, Inc.
Notes to the Consolidated Financial Statements — (Continued)
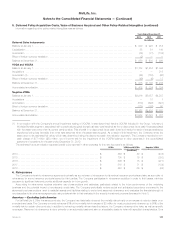
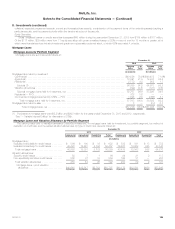
8. Investments (continued)
agricultural mortgage loan portfolios, residential mortgage loans are smaller-balance homogeneous loans that are collectively evaluated for impairment.
Non-specific valuation allowances are established using the evaluation framework described above for pools of loans with similar risk characteristics
from inputs that are unique to the residential segment of the loan portfolio. Loan specific valuation allowances are only established on residential
mortgage loans when they have been restructured and are established using the methodology described above for all loan portfolio segments.
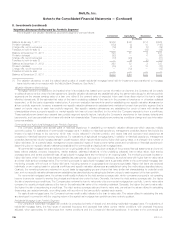
For residential mortgage loans, the Company’s primary credit quality indicator is whether the loan is performing or nonperforming. The Company
generally defines nonperforming residential mortgage loans as those that are 60 or more days past due and/or in non-accrual status which is
assessed monthly. Generally, nonperforming residential mortgage loans have a higher risk of experiencing a credit loss.
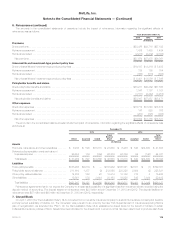
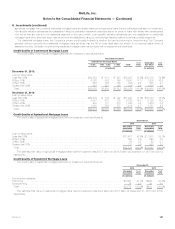
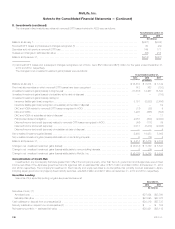
Credit Quality of Commercial Mortgage Loans
The credit quality of commercial mortgage loans held-for-investment, were as follows at:
Recorded Investment
Estimated
Fair Value %of
Total
Debt Service Coverage Ratios
Total %of
Total> 1.20x 1.00x - 1.20x < 1.00x
(In millions) (In millions)
December 31, 2013:
Loan-to-value ratios:
Less than 65% .............................................. $30,552 $ 614 $ 841 $32,007 78.2% $33,519 78.9%
65%to75% ................................................ 6,360 438 149 6,947 17.0 7,039 16.6
76%to80% ................................................ 525 192 189 906 2.2 892 2.1
Greater than 80% ............................................ 661 242 163 1,066 2.6 1,006 2.4
Total ..................................................... $38,098 $1,486 $1,342 $40,926 100.0% $42,456 100.0%
December 31, 2012:
Loan-to-value ratios:
Less than 65% .............................................. $29,839 $ 730 $ 722 $31,291 77.3% $33,730 78.3%
65%to75% ................................................ 5,057 672 153 5,882 14.6 6,129 14.2
76%to80% ................................................ 938 131 316 1,385 3.4 1,436 3.3
Greater than 80% ............................................ 1,085 552 277 1,914 4.7 1,787 4.2
Total ..................................................... $36,919 $2,085 $1,468 $40,472 100.0% $43,082 100.0%
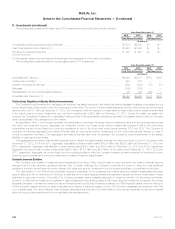
Credit Quality of Agricultural Mortgage Loans
The credit quality of agricultural mortgage loans held-for-investment, were as follows at:
December 31,
2013 2012
Recorded
Investment %of
Total Recorded
Investment %of
Total
(In millions) (In millions)
Loan-to-value ratios:
Less than 65% ......................................................................... $11,461 92.5% $11,908 92.7%
65%to75% ........................................................................... 729 5.9 590 4.6
76%to80% ........................................................................... 84 0.7 92 0.7
Greater than 80% ....................................................................... 117 0.9 253 2.0
Total ................................................................................ $12,391 100.0% $12,843 100.0%
The estimated fair value of agricultural mortgage loans held-for-investment was $12.7 billion and $13.3 billion at December 31, 2013 and 2012,
respectively.
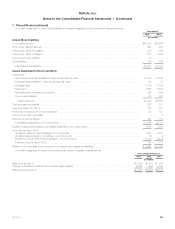
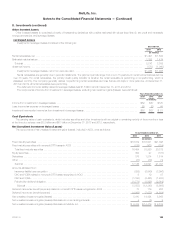
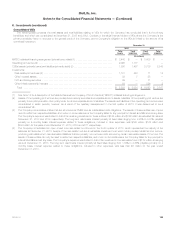
Credit Quality of Residential Mortgage Loans
The credit quality of residential mortgage loans held-for-investment, were as follows at:
December 31,
2013 2012
Recorded
Investment %of
Total Recorded
Investment %of
Total
(In millions) (In millions)
Performance indicators:
Performing ............................................................................ $2,693 97.1% $929 97.0%
Nonperforming ......................................................................... 79 2.9 29 3.0
Total ................................................................................ $2,772 100.0% $958 100.0%
The estimated fair value of residential mortgage loans held-for-investment was $2.8 billion and $1.0 billion at December 31, 2013 and 2012,
respectively.
MetLife, Inc. 127