MetLife 2013 Annual Report Download - page 196
Download and view the complete annual report
Please find page 196 of the 2013 MetLife annual report below. You can navigate through the pages in the report by either clicking on the pages listed below, or by using the keyword search tool below to find specific information within the annual report.-
 1
1 -
2
-
3
-
4
-
5
-
6
-
7
-
8
-
9
-
10
-
11
-
12
-
13
-
14
-
15
-
16
-
17
-
18
-
19
-
20
-
21
-
22
-
23
-
24
-
25
-
26
-
27
-
28
-
29
-
30
-
31
-
32
-
33
-
34
-
35
-
36
-
37
-
38
-
39
-
40
-
41
-
42
-
43
-
44
-
45
-
46
-
47
-
48
-
49
-
50
-
51
-
52
-
53
-
54
-
55
-
56
-
57
-
58
-
59
-
60
-
61
-
62
-
63
-
64
-
65
-
66
-
67
-
68
-
69
-
70
-
71
-
72
-
73
-
74
-
75
-
76
-
77
-
78
-
79
-
80
-
81
-
82
-
83
-
84
-
85
-
86
-
87
-
88
-
89
-
90
-
91
-
92
-
93
-
94
-
95
-
96
-
97
-
98
-
99
-
100
-
101
-
102
-
103
-
104
-
105
-
106
-
107
-
108
-
109
-
110
-
111
-
112
-
113
-
114
-
115
-
116
-
117
-
118
-
119
-
120
-
121
-
122
-
123
-
124
-
125
-
126
-
127
-
128
-
129
-
130
-
131
-
132
-
133
-
134
-
135
-
136
-
137
-
138
-
139
-
140
-
141
-
142
-
143
-
144
-
145
-
146
-
147
-
148
-
149
-
150
-
151
-
152
-
153
-
154
-
155
-
156
-
157
-
158
-
159
-
160
-
161
-
162
-
163
-
164
-
165
-
166
-
167
-
168
-
169
-
170
-
171
-
172
-
173
-
174
-
175
-
176
-
177
-
178
-
179
-
180
-
181
-
182
-
183
-
184
-
185
-
 186
186 -
 187
187 -
 188
188 -
 189
189 -
 190
190 -
 191
191 -
 192
192 -
 193
193 -
 194
194 -
 195
195 -
 196
196 -
 197
197 -
 198
198 -
 199
199 -
 200
200 -
 201
201 -
 202
202 -
 203
203 -
 204
204 -
 205
205 -
 206
206 -
207
-
208
-
209
-
210
-
211
-
212
-
213
-
214
-
215
-
216
-
217
-
218
-
219
-
220
-
221
-
222
-
223
-
224
 |
 |

MetLife, Inc.
Notes to the Consolidated Financial Statements — (Continued)
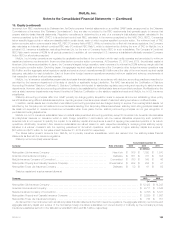
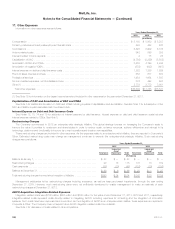
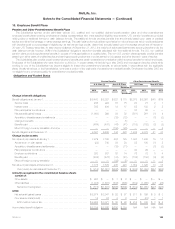
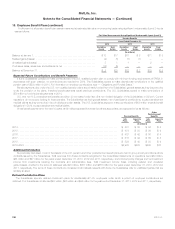
17. Other Expenses
Information on other expenses was as follows:
Years Ended December 31,
2013 2012 2011
(In millions)
Compensation ................................................................................ $ 5,108 $ 5,562 $ 5,287
Pension, postretirement and postemployment benefit costs ............................................. 488 428 463
Commissions ................................................................................. 5,428 5,909 6,378
Volume-related costs ........................................................................... 842 599 335
Interest credited to bank deposits ................................................................. 2 78 95
Capitalization of DAC ........................................................................... (4,786) (5,289) (5,558)
Amortization of DAC and VOBA ................................................................... 3,550 4,199 4,898
Amortization of negative VOBA .................................................................... (579) (622) (697)
Interest expense on debt and debt issuance costs .................................................... 1,282 1,356 1,629
Premium taxes, licenses and fees ................................................................. 658 677 633
Professional services ........................................................................... 1,454 1,664 1,597
Rent and related expenses, net of sublease income ................................................... 376 422 426
Other (1) ..................................................................................... 2,779 2,772 3,051
Total other expenses ......................................................................... $16,602 $17,755 $18,537
(1) See Note 19 for information on the Japan income tax refund included in other expenses for the year ended December 31, 2013.
Capitalization of DAC and Amortization of DAC and VOBA
See Note 5 for additional information on DAC and VOBA including impacts of capitalization and amortization. See also Note 7 for a description of the
DAC amortization impact associated with the closed block.
Interest Expense on Debt and Debt Issuance Costs
See Notes 12, 13, 14 and 15 for attribution of interest expense by debt issuance. Interest expense on debt and debt issuance costs includes
interest expense related to CSEs. See Note 8.
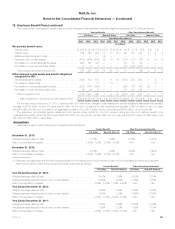
Restructuring Charges
The Company commenced in 2012 an enterprise-wide strategic initiative. This global strategy focuses on leveraging the Company’s scale to
improve the value it provides to customers and shareholders in order to reduce costs, enhance revenues, achieve efficiencies and reinvest in its
technology, platforms and functionality to improve its current operations and develop new capabilities.
These restructuring charges are included in other expenses. As the expenses relate to an enterprise-wide initiative, they are reported in Corporate &
Other. Estimated restructuring costs may change as management continues to execute this enterprise-wide strategic initiative. Such restructuring
charges were as follows:
Years Ended December 31,
2013 2012
Severance
Lease and
Asset
Impairment Total Severance
Lease and
Asset
Impairment Total
(In millions)
Balance at January 1, ................................................. $ 23 $— $ 23 $ — $— $ —
Restructuring charges ................................................. 99 16 115 141 18 159
Cash payments ...................................................... (82) (10) (92) (118) (18) (136)
Balance at December 31, .............................................. $ 40 $ 6 $ 46 $ 23 $ — $ 23
Total restructuring charges incurred since inception of initiative ................. $240 $ 34 $274 $ 141 $ 18 $ 159
Management anticipates further restructuring charges including severance, as well as lease and asset impairments, through the year ending
December 31, 2015. However, such restructuring plans were not sufficiently developed to enable management to make an estimate of such
restructuring charges at December 31, 2013.
ALICO Acquisition Integration-Related Expenses
Integration-related costs were $138 million, $305 million and $362 million for the years ended December 31, 2013, 2012 and 2011, respectively.
Integration-related costs represent costs directly related to integrating ALICO, including expenses for consulting and the integration of information
systems. Such costs have been expensed as incurred and, as the integration of ALICO is an enterprise-wide initiative, these expenses are reported in
Corporate & Other. The Company does not expect future ALICO integration-related costs to be material.
See Note 3 for discussion of costs related to other acquisitions.
188 MetLife, Inc.