MetLife 2013 Annual Report Download - page 45
Download and view the complete annual report
Please find page 45 of the 2013 MetLife annual report below. You can navigate through the pages in the report by either clicking on the pages listed below, or by using the keyword search tool below to find specific information within the annual report.-
 1
1 -
2
-
3
-
4
-
5
-
6
-
7
-
8
-
9
-
10
-
11
-
12
-
13
-
14
-
15
-
16
-
17
-
18
-
19
-
20
-
21
-
22
-
23
-
24
-
25
-
26
-
27
-
28
-
29
-
30
-
31
-
32
-
33
-
34
-
 35
35 -
 36
36 -
 37
37 -
 38
38 -
 39
39 -
 40
40 -
 41
41 -
 42
42 -
 43
43 -
 44
44 -
 45
45 -
 46
46 -
 47
47 -
 48
48 -
 49
49 -
 50
50 -
 51
51 -
 52
52 -
 53
53 -
 54
54 -
 55
55 -
56
-
57
-
58
-
59
-
60
-
61
-
62
-
63
-
64
-
65
-
66
-
67
-
68
-
69
-
70
-
71
-
72
-
73
-
74
-
75
-
76
-
77
-
78
-
79
-
80
-
81
-
82
-
83
-
84
-
85
-
86
-
87
-
88
-
89
-
90
-
91
-
92
-
93
-
94
-
95
-
96
-
97
-
98
-
99
-
100
-
101
-
102
-
103
-
104
-
105
-
106
-
107
-
108
-
109
-
110
-
111
-
112
-
113
-
114
-
115
-
116
-
117
-
118
-
119
-
120
-
121
-
122
-
123
-
124
-
125
-
126
-
127
-
128
-
129
-
130
-
131
-
132
-
133
-
134
-
135
-
136
-
137
-
138
-
139
-
140
-
141
-
142
-
143
-
144
-
145
-
146
-
147
-
148
-
149
-
150
-
151
-
152
-
153
-
154
-
155
-
156
-
157
-
158
-
159
-
160
-
161
-
162
-
163
-
164
-
165
-
166
-
167
-
168
-
169
-
170
-
171
-
172
-
173
-
174
-
175
-
176
-
177
-
178
-
179
-
180
-
181
-
182
-
183
-
184
-
185
-
186
-
187
-
188
-
189
-
190
-
191
-
192
-
193
-
194
-
195
-
196
-
197
-
198
-
199
-
200
-
201
-
202
-
203
-
204
-
205
-
206
-
207
-
208
-
209
-
210
-
211
-
212
-
213
-
214
-
215
-
216
-
217
-
218
-
219
-
220
-
221
-
222
-
223
-
224
 |
 |

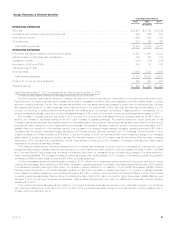
Year Ended December 31, 2012 Compared with the Year Ended December 31, 2011
Unless otherwise stated, all amounts discussed below are net of income tax.
Operating earnings increased by $20 million over 2011. The impact of changes in foreign currency exchange rates reduced operating earnings by
$23 million for 2012 compared to 2011 and resulted in significant variances in the financial statement line items. The fourth quarter 2011 purchase of
a Turkish life insurance and pension company and the third quarter 2012 acquisition of life insurance businesses in the Czech Republic, Hungary and
Romania from the members of the Aviva Plc. group increased operating earnings by $15 million.
The segment continued to experience business growth; however, certain European countries in the region continued to be affected by the
challenging economic environment. Sales for all major product lines increased when compared to 2011 across all geographic regions. Retirement
sales were generated primarily by strong sales of variable annuity products in western Europe. Accident and health sales increased primarily due to
the establishment of a new direct marketing channel in the Middle East. Life insurance sales increased primarily due to variable life sales in the Middle
East. Credit life sales increased primarily due to sales in the Middle East and eastern and southern Europe resulting in higher premiums and
policyholder benefits. Operating expenses increased across all regions due to business growth, including higher lease expenses and payroll costs
due to business expansion in western Europe. The increased sales generated an increase in commissions, which was largely offset by related DAC
capitalization. Fee income increased largely due to higher sales of variable life products in central and western Europe. The combined impact of the
items discussed above reduced operating earnings by $24 million.
Operating earnings were negatively affected by lower net investment income of $56 million, primarily due to the disposal of certain closed blocks
of business in the U.K. and lower average invested assets as a result of dividends paid to MetLife, Inc. at the end of 2011.
Operating earnings increased $74 million reflecting higher investment yields. The increase in yields reflects higher returns on certain securities,
primarily in Poland, and higher returns on mutual fund investments, primarily in Greece (both driven by improving equity markets), as well as invested
asset growth in higher yielding markets including Egypt and the Ukraine.
Operating earnings benefited by $13 million primarily due to a release of negative VOBA associated with the conversion of certain policies, partially
offset by an adjustment related to additional liabilities for annuitants. In addition, income tax was lower in 2012 by $18 million primarily due to
permanently reinvested earnings in Poland.
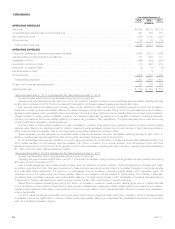
Corporate & Other
Years Ended December 31,
2013 2012 2011
(In millions)
OPERATING REVENUES
Premiums ....................................................................................... $ 116 $ 56 $ 54
Universal life and investment-type product policy fees ..................................................... 139 155 155
Net investment income ............................................................................. 381 703 888
Other revenues ................................................................................... 28 33 60
Total operating revenues .......................................................................... 664 947 1,157
OPERATING EXPENSES
Policyholder benefits and claims and policyholder dividends ................................................ 63 119 126
Interest credited to policyholder account balances ........................................................ 42 39 —
Capitalization of DAC .............................................................................. (28) — —
Amortization of DAC and VOBA ...................................................................... 1 2 1
Interest expense on debt ........................................................................... 1,148 1,176 1,293
Other expenses .................................................................................. 894 559 505
Total operating expenses ......................................................................... 2,120 1,895 1,925
Provision for income tax expense (benefit) .............................................................. (925) (679) (584)
Operating earnings ................................................................................ (531) (269) (184)
Less: Preferred stock dividends ...................................................................... 122 122 122
Operating earnings available to common shareholders .................................................... $ (653) $ (391) $ (306)
MetLife, Inc. 37