MetLife 2013 Annual Report Download - page 5
Download and view the complete annual report
Please find page 5 of the 2013 MetLife annual report below. You can navigate through the pages in the report by either clicking on the pages listed below, or by using the keyword search tool below to find specific information within the annual report.
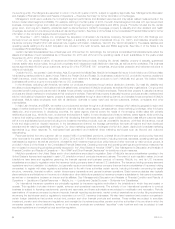
In November of 2011, roughly one year after we acquired Alico, we reorganized MetLife into three broad regions – the
Americas, Asia, and Europe, Middle East & Africa (EMEA). From a portfolio point of view, all three regions have different
risk profiles, which aids diversification, and all three regions are expected to increase earnings over time. Combined with
our strategy to shift the business mix from market-sensitive, capital-intensive products toward protection-oriented, capital-
efficient products, we believe we are well positioned for profitable growth.
Our outlook for MetLife’s biggest region, the Americas, is mid-single-digit operating earnings growth over the long
term. While the United States is a mature life insurance market, we still see a number of attractive growth opportunities.
We believe the voluntary and worksite businesses within Group, Voluntary & Worksite Benefits hold particularly strong
promise, and we expect heightened demand for pension closeouts to fuel growth in Corporate Benefit Funding. Our
Retail business is expected to grow more modestly but with a dramatically improved risk profile. In Latin America, we
expect growth rates in the low teens. We have market-leading positions in Mexico and Chile and a growing presence in
markets such as Brazil and Colombia. All of our markets in Latin America feature an attractive combination of relatively low
insurance penetration rates and a growing middle class.
In Asia, we see long-term operating earnings growth in the high-single to low-double digits, with the upper end of the
range dependent on our success in emerging markets. Today, our earnings are predominantly sourced from Japan.
Although Japan is a mature market, our diverse distribution platform, enhanced customer centricity, and opportunities
within risk and protection products should allow us to achieve a 5-to-7% top-line growth rate, faster than the low-single-
digit growth rate for the overall market. Overall, we saw the Asia region deliver 12% growth in premiums, fees and other
revenues last year on a constant currency basis. Looking ahead, we see Southeast Asian markets contributing to our
growth story. In 2013, we expanded our footprint in the region by signing joint ventures with leading banks in Malaysia
and Vietnam and establishing a representative office in Myanmar.
In EMEA, we see long-term operating earnings growth in the low teens. Key earnings contributors in the region
include Poland and the Gulf States. With 30 markets overall, EMEA is well diversified not just from a product and
distribution standpoint but also in terms of geopolitical risk. We believe that rigorous analysis combined with broad
country diversification is the best way to manage political risk in emerging markets. What makes these markets so
attractive is that the product mix generally has a more favorable risk-return profile than products sold in mature markets.
Focus on Cash
One of the tangible ways our strategy will demonstrate success is by generating an increasing amount of free cash
flow.2We currently anticipate that the ratio of free cash flow to operating earnings will improve from approximately 35%
today to a range of 45% to 55% during 2015-2016, assuming a reasonable regulatory environment and a gradual rise in
interest rates.
One of the lessons from my career in private equity and fixed income is the importance of cash flow. In private equity,
cash flow expectations drive the investment decision-making process, and success or failure often hinges on the
accuracy of these forecasts. In fixed income, you learn quickly that companies service debt with cash flow, not GAAP
earnings. For a life insurance company, free cash flow is meaningful not only because it determines what can be
distributed to shareholders in the form of dividends and share repurchases, but also because it provides a reality check
on the quality of operating earnings. Life insurance companies have complex financial statements that can lead to
valuation discounts in the marketplace. We believe a higher ratio of free cash flow to operating earnings will improve our
valuation over time.
No discussion of cash would be complete without some commentary on capital management. I know that a number
of our shareholders are frustrated with our cautious approach to returning cash during this period of regulatory
uncertainty. We share your frustration.
2Free cash flow is defined as cash generated by subsidiaries less expenses and other net flows at the holding company and potentially available for
dividends, stock buybacks, debt reduction and M&A, subject to our target of maintaining an AA financial strength rating.
MetLife, Inc. iii

