MetLife 2013 Annual Report Download - page 83
Download and view the complete annual report
Please find page 83 of the 2013 MetLife annual report below. You can navigate through the pages in the report by either clicking on the pages listed below, or by using the keyword search tool below to find specific information within the annual report.-
 1
1 -
2
-
3
-
4
-
5
-
6
-
7
-
8
-
9
-
10
-
11
-
12
-
13
-
14
-
15
-
16
-
17
-
18
-
19
-
20
-
21
-
22
-
23
-
24
-
25
-
26
-
27
-
28
-
29
-
30
-
31
-
32
-
33
-
34
-
35
-
36
-
37
-
38
-
39
-
40
-
41
-
42
-
43
-
44
-
45
-
46
-
47
-
48
-
49
-
50
-
51
-
52
-
53
-
54
-
55
-
56
-
57
-
58
-
59
-
60
-
61
-
62
-
63
-
64
-
65
-
66
-
67
-
68
-
69
-
70
-
71
-
72
-
 73
73 -
 74
74 -
 75
75 -
 76
76 -
 77
77 -
 78
78 -
 79
79 -
 80
80 -
 81
81 -
 82
82 -
 83
83 -
 84
84 -
 85
85 -
 86
86 -
 87
87 -
 88
88 -
 89
89 -
 90
90 -
 91
91 -
 92
92 -
 93
93 -
94
-
95
-
96
-
97
-
98
-
99
-
100
-
101
-
102
-
103
-
104
-
105
-
106
-
107
-
108
-
109
-
110
-
111
-
112
-
113
-
114
-
115
-
116
-
117
-
118
-
119
-
120
-
121
-
122
-
123
-
124
-
125
-
126
-
127
-
128
-
129
-
130
-
131
-
132
-
133
-
134
-
135
-
136
-
137
-
138
-
139
-
140
-
141
-
142
-
143
-
144
-
145
-
146
-
147
-
148
-
149
-
150
-
151
-
152
-
153
-
154
-
155
-
156
-
157
-
158
-
159
-
160
-
161
-
162
-
163
-
164
-
165
-
166
-
167
-
168
-
169
-
170
-
171
-
172
-
173
-
174
-
175
-
176
-
177
-
178
-
179
-
180
-
181
-
182
-
183
-
184
-
185
-
186
-
187
-
188
-
189
-
190
-
191
-
192
-
193
-
194
-
195
-
196
-
197
-
198
-
199
-
200
-
201
-
202
-
203
-
204
-
205
-
206
-
207
-
208
-
209
-
210
-
211
-
212
-
213
-
214
-
215
-
216
-
217
-
218
-
219
-
220
-
221
-
222
-
223
-
224
 |
 |

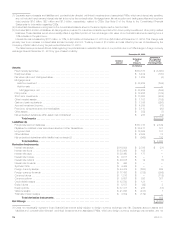
The table below illustrates the potential loss in estimated fair value for each market risk exposure of our market sensitive assets and liabilities at
December 31, 2013:
December 31, 2013
(In millions)
Non-trading:
Interest rate risk ........................................................................... $6,777
Foreign currency exchange rate risk ........................................................... $6,562
Equity market risk ......................................................................... $ 95
Trading:
Interest rate risk ........................................................................... $ 11
Foreign currency exchange rate risk ........................................................... $ 5
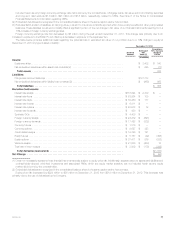
The table below provides additional detail regarding the potential loss in estimated fair value of our trading and non-trading interest sensitive financial
instruments at December 31, 2013 by type of asset or liability: December 31, 2013
Notional
Amount
Estimated
Fair
Value (1)
Assuming a
10% Increase in
the Yield Curve
(In millions)
Assets:
Fixed maturity securities .............................................................. $350,187 $(6,684)
Equity securities .................................................................... $ 3,402 —
Fair value option and trading securities .................................................. $ 1,289 (11)
Mortgage loans:
Held-for-investment ............................................................... $ 58,259 (380)
Held-for-sale ..................................................................... 3 —
Mortgage loans, net ............................................................. $ 58,262 (380)
Policy loans ....................................................................... $ 13,206 (135)
Short-term investments .............................................................. $ 13,955 (2)
Other invested assets ............................................................... $ 1,103 —
Cash and cash equivalents ........................................................... $ 7,585 —
Accrued investment income ........................................................... $ 4,255 —
Premiums, reinsurance and other receivables ............................................. $ 3,110 (155)
Other assets ....................................................................... $ 352 (5)
Net embedded derivatives within asset host contracts (2) .................................... $ 285 (22)
Total assets .................................................................. $(7,394)
Liabilities: (3)
Policyholder account balances ........................................................ $137,773 $ 597
Payables for collateral under securities loaned and other transactions ........................... $ 30,411 —
Short-term debt .................................................................... $ 175 —
Long-term debt .................................................................... $ 18,564 363
Collateral financing arrangements ...................................................... $ 3,984 —
Junior subordinated debt securities ..................................................... $ 3,789 133
Other liabilities: .....................................................................
Trading liabilities .................................................................. $ 262 5
Other .......................................................................... $ 2,240 124
Net embedded derivatives within liability host contracts (2) ................................... $ (969) 528
Total liabilities ................................................................ $ 1,750
Derivative Instruments:
Interest rate swaps .................................................................. $116,894 $ 2,709 $ (935)
Interest rate floors ................................................................... $ 63,064 $ 105 (16)
Interest rate caps ................................................................... $ 39,460 $ 177 52
Interest rate futures .................................................................. $ 6,011 $ — 5
Interest rate options ................................................................. $ 40,978 $ 12 (127)
Interest rate forwards ................................................................ $ 450 $ — (30)
Synthetic GICs ..................................................................... $ 4,409 $ — —
Foreign currency swaps .............................................................. $ 24,472 $ (693) (15)
Foreign currency forwards ............................................................ $ 17,428 $ (332) (2)
Currency futures .................................................................... $ 1,316 $ — —
Currency options ................................................................... $ 9,627 $ 323 (7)
Credit default swaps ................................................................ $ 12,780 $ 121 —
Equity futures ...................................................................... $ 5,157 $ (42) —
Equity options ...................................................................... $ 37,411 $ 276 (72)
Variance swaps .................................................................... $ 21,636 $ (403) 3
Total rate of return swaps ............................................................. $ 3,802 $ (179) —
Total derivative instruments .................................................... $(1,144)
Net Change ........................................................................ $(6,788)
MetLife, Inc. 75