MetLife 2013 Annual Report Download - page 75
Download and view the complete annual report
Please find page 75 of the 2013 MetLife annual report below. You can navigate through the pages in the report by either clicking on the pages listed below, or by using the keyword search tool below to find specific information within the annual report.-
 1
1 -
2
-
3
-
4
-
5
-
6
-
7
-
8
-
9
-
10
-
11
-
12
-
13
-
14
-
15
-
16
-
17
-
18
-
19
-
20
-
21
-
22
-
23
-
24
-
25
-
26
-
27
-
28
-
29
-
30
-
31
-
32
-
33
-
34
-
35
-
36
-
37
-
38
-
39
-
40
-
41
-
42
-
43
-
44
-
45
-
46
-
47
-
48
-
49
-
50
-
51
-
52
-
53
-
54
-
55
-
56
-
57
-
58
-
59
-
60
-
61
-
62
-
63
-
64
-
 65
65 -
 66
66 -
 67
67 -
 68
68 -
 69
69 -
 70
70 -
 71
71 -
 72
72 -
 73
73 -
 74
74 -
 75
75 -
 76
76 -
 77
77 -
 78
78 -
 79
79 -
 80
80 -
 81
81 -
 82
82 -
 83
83 -
 84
84 -
 85
85 -
86
-
87
-
88
-
89
-
90
-
91
-
92
-
93
-
94
-
95
-
96
-
97
-
98
-
99
-
100
-
101
-
102
-
103
-
104
-
105
-
106
-
107
-
108
-
109
-
110
-
111
-
112
-
113
-
114
-
115
-
116
-
117
-
118
-
119
-
120
-
121
-
122
-
123
-
124
-
125
-
126
-
127
-
128
-
129
-
130
-
131
-
132
-
133
-
134
-
135
-
136
-
137
-
138
-
139
-
140
-
141
-
142
-
143
-
144
-
145
-
146
-
147
-
148
-
149
-
150
-
151
-
152
-
153
-
154
-
155
-
156
-
157
-
158
-
159
-
160
-
161
-
162
-
163
-
164
-
165
-
166
-
167
-
168
-
169
-
170
-
171
-
172
-
173
-
174
-
175
-
176
-
177
-
178
-
179
-
180
-
181
-
182
-
183
-
184
-
185
-
186
-
187
-
188
-
189
-
190
-
191
-
192
-
193
-
194
-
195
-
196
-
197
-
198
-
199
-
200
-
201
-
202
-
203
-
204
-
205
-
206
-
207
-
208
-
209
-
210
-
211
-
212
-
213
-
214
-
215
-
216
-
217
-
218
-
219
-
220
-
221
-
222
-
223
-
224
 |
 |

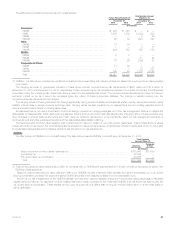
Amounts presented represent the estimated cash payments undiscounted as to interest and including assumptions related to the receipt of future
premiums and deposits; withdrawals, including unscheduled or partial withdrawals; policy lapses; surrender charges; annuitization; mortality; future
interest credited; policy loans and other contingent events as appropriate for the respective product type. Such estimated cash payments are also
presented net of estimated future premiums on policies currently in-force and gross of any reinsurance recoverable. For obligations denominated in
foreign currencies, cash payments have been estimated using current spot foreign currency rates.
The sum of the estimated cash flows shown for all years of $294.0 billion exceeds the liability amount of $212.9 billion included on the
consolidated balance sheets principally due to (i) the time value of money, which accounts for a substantial portion of the difference; (ii) differences in
assumptions, between the date the liabilities were initially established and the current date; and (iii) liabilities related to accounting conventions, or
which are not contractually due, which are excluded.
Payables for Collateral Under Securities Loaned and Other Transactions
We have accepted cash collateral in connection with securities lending and derivatives. As the securities lending transactions expire within the
next year and the timing of the return of the derivatives collateral is uncertain, the return of the collateral has been included in the one year or less
category in the table. We also held non-cash collateral, which is not reflected as a liability in the consolidated balance sheets of $2.3 billion at
December 31, 2013.
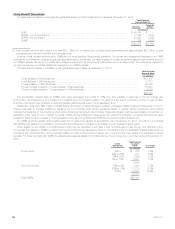
Debt
Amounts presented for debt include short-term debt, long-term debt, collateral financing arrangements and junior subordinated debt securities,
the total of which differs from the total of the corresponding amounts presented on the consolidated balance sheet due to the following: (i) the
amounts presented herein do not include premiums or discounts upon issuance or purchase accounting fair value adjustments; (ii) the amounts
presented herein include future interest on such obligations for the period from January 1, 2014 through maturity; and (iii) the amounts presented
herein do not include $1.5 billion at December 31, 2013 of long-term debt relating to CSEs — FVO as such debt does not represent our contractual
obligations. Future interest on variable rate debt was computed using prevailing rates at December 31, 2013 and, as such, does not consider the
impact of future rate movements. Future interest on fixed rate debt was computed using the stated rate on the obligations for the period from
January 1, 2014 through maturity, except with respect to junior subordinated debt which was computed using the stated rates through the scheduled
redemption dates as it is our expectation that such obligations will be redeemed at that time. Inclusion of interest payments on junior subordinated
debt securities through the final maturity dates would increase the contractual obligation by $7.7 billion. Pursuant to collateral financing arrangements,
MetLife, Inc. may be required to deliver cash or pledge collateral to the respective unaffiliated financial institutions. See Note 13 of the Notes to the
Consolidated Financial Statements.
Investment Commitments
To enhance the return on our investment portfolio, we commit to lend funds under mortgage loans, bank credit facilities, bridge loans and private
corporate bond investments and we commit to fund partnership investments. In the table, the timing of the funding of mortgage loans and private
corporate bond investments is based on the expiration dates of the corresponding commitments. As it relates to commitments to fund partnerships
and bank credit facilities, we anticipate that these amounts could be invested any time over the next five years; however, as the timing of the fulfillment
of the obligation cannot be predicted, such obligations are presented in the one year or less category. Commitments to fund bridge loans are short-
term obligations and, as a result, are presented in the one year or less category. See Note 21 of the Notes to the Consolidated Financial Statements
and “— Off-Balance Sheet Arrangements.”
Operating Leases
As a lessee, we have various operating leases, primarily for office space. Contractual provisions exist that could increase or accelerate those lease
obligations presented, including various leases with early buyouts and/or escalation clauses. However, the impact of any such transactions would not
be material to our financial position or results of operations. See Note 21 of the Notes to the Consolidated Financial Statements.
Other
Other obligations presented are principally comprised of amounts due under reinsurance agreements, payables related to securities purchased
but not yet settled, securities sold short, accrued interest on debt obligations, estimated fair value of derivative obligations, deferred compensation
arrangements, guaranty liabilities, the estimated fair value of forward stock purchase contracts, and accruals and accounts payable due under
contractual obligations, which are all reported in other liabilities on the consolidated balance sheets. If the timing of any of these other obligations is
sufficiently uncertain, the amounts are included within the one year or less category. Items reported in other liabilities on the consolidated balance
sheets that were excluded from the table represent accounting conventions or are not liabilities due under contractual obligations. Unrecognized tax
benefits and related accrued interest totaling $1.0 billion was excluded as the timing of payment cannot be reliably determined.
Separate account liabilities are excluded as they are fully funded by cash flows from the corresponding separate account assets and are set equal
to the estimated fair value of separate account assets.
We also enter into agreements to purchase goods and services in the normal course of business; however, such amounts are excluded as these
purchase obligations were not material to our consolidated results of operations or financial position at December 31, 2013.
Additionally, we have agreements in place for services we conduct, generally at cost, between subsidiaries relating to insurance, reinsurance,
loans and capitalization. Intercompany transactions have been eliminated in consolidation. Intercompany transactions among insurance subsidiaries
and affiliates have been approved by the appropriate insurance regulators as required.
MetLife, Inc.
Liquidity Management and Capital Management
Liquidity and capital are managed to preserve stable, reliable and cost-effective sources of cash to meet all current and future financial obligations
and are provided by a variety of sources, including a portfolio of liquid assets, a diversified mix of short- and long-term funding sources from the
wholesale financial markets and the ability to borrow through credit and committed facilities. Liquidity is monitored through the use of internal liquidity risk
metrics, including the composition and level of the liquid asset portfolio, timing differences in short-term cash flow obligations, access to the financial
markets for capital and debt transactions and exposure to contingent draws on MetLife, Inc.’s liquidity. MetLife, Inc. is an active participant in theglobal
financial markets through which it obtains a significant amount of funding. These markets, which serve as cost-effective sources of funds, are critical
components of MetLife, Inc.’s liquidity and capital management. Decisions to access these markets are based upon relative costs, prospective views of
balance sheet growth and a targeted liquidity profile and capital structure. A disruption in the financial markets could limit MetLife, Inc.’s access to liquidity.
MetLife, Inc. 67