MetLife 2013 Annual Report Download - page 151
Download and view the complete annual report
Please find page 151 of the 2013 MetLife annual report below. You can navigate through the pages in the report by either clicking on the pages listed below, or by using the keyword search tool below to find specific information within the annual report.-
 1
1 -
2
-
3
-
4
-
5
-
6
-
7
-
8
-
9
-
10
-
11
-
12
-
13
-
14
-
15
-
16
-
17
-
18
-
19
-
20
-
21
-
22
-
23
-
24
-
25
-
26
-
27
-
28
-
29
-
30
-
31
-
32
-
33
-
34
-
35
-
36
-
37
-
38
-
39
-
40
-
41
-
42
-
43
-
44
-
45
-
46
-
47
-
48
-
49
-
50
-
51
-
52
-
53
-
54
-
55
-
56
-
57
-
58
-
59
-
60
-
61
-
62
-
63
-
64
-
65
-
66
-
67
-
68
-
69
-
70
-
71
-
72
-
73
-
74
-
75
-
76
-
77
-
78
-
79
-
80
-
81
-
82
-
83
-
84
-
85
-
86
-
87
-
88
-
89
-
90
-
91
-
92
-
93
-
94
-
95
-
96
-
97
-
98
-
99
-
100
-
101
-
102
-
103
-
104
-
105
-
106
-
107
-
108
-
109
-
110
-
111
-
112
-
113
-
114
-
115
-
116
-
117
-
118
-
119
-
120
-
121
-
122
-
123
-
124
-
125
-
126
-
127
-
128
-
129
-
130
-
131
-
132
-
133
-
134
-
135
-
136
-
137
-
138
-
139
-
140
-
 141
141 -
 142
142 -
 143
143 -
 144
144 -
 145
145 -
 146
146 -
 147
147 -
 148
148 -
 149
149 -
 150
150 -
 151
151 -
 152
152 -
 153
153 -
 154
154 -
 155
155 -
 156
156 -
 157
157 -
 158
158 -
 159
159 -
 160
160 -
 161
161 -
162
-
163
-
164
-
165
-
166
-
167
-
168
-
169
-
170
-
171
-
172
-
173
-
174
-
175
-
176
-
177
-
178
-
179
-
180
-
181
-
182
-
183
-
184
-
185
-
186
-
187
-
188
-
189
-
190
-
191
-
192
-
193
-
194
-
195
-
196
-
197
-
198
-
199
-
200
-
201
-
202
-
203
-
204
-
205
-
206
-
207
-
208
-
209
-
210
-
211
-
212
-
213
-
214
-
215
-
216
-
217
-
218
-
219
-
220
-
221
-
222
-
223
-
224
 |
 |
MetLife, Inc.
Notes to the Consolidated Financial Statements — (Continued)
9. Derivatives (continued)
At December 31, 2013 and 2012, the maximum length of time over which the Company was hedging its exposure to variability in future cash flows
for forecasted transactions did not exceed seven years and eight years, respectively.
At December 31, 2013 and 2012, the balance in AOCI associated with cash flow hedges was $375 million and $1.3 billion, respectively.
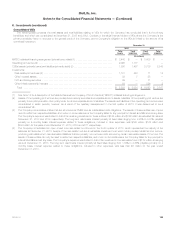
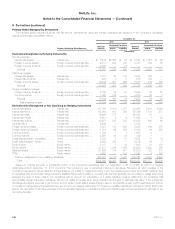
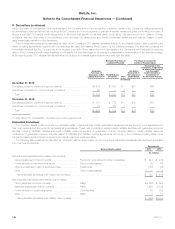
The following table presents the effects of derivatives in cash flow hedging relationships on the consolidated statements of operations and the
consolidated statements of equity:
Derivatives in Cash Flow
Hedging Relationships
Amount of Gains (Losses)
Deferred in
AOCI on Derivatives
Amount and Location of Gains
(Losses) Reclassified from
AOCI into Income (Loss)
Amount and Location
of Gains (Losses)
Recognized in Income (Loss)
on Derivatives
(Effective Portion) (Effective Portion) (Ineffective Portion)
Net Derivative
Gains (Losses) Net Investment
Income Other
Expenses Net Derivative
Gains (Losses)
(In millions)
Year Ended December 31, 2013:
Interest rate swaps .......................................... $ (635) $ 20 $ 8 $ — $ (3)
Interest rate forwards ........................................ (59) 10 3 (1) 1
Foreign currency swaps ...................................... (165) (3) (3) 1 3
Credit forwards ............................................ (4) — 1 — —
Total ................................................... $ (863) $ 27 $ 9 $ — $ 1
Year Ended December 31, 2012:
Interest rate swaps .......................................... $ (34) $ 1 $ 4 $ (3) $ 2
Interest rate forwards ........................................ (17) 1 2 (1) —
Foreign currency swaps ...................................... (164) 23 (5) 1 (6)
Credit forwards ............................................ — — 1 — —
Total ................................................... $ (215) $ 25 $ 2 $ (3) $ (4)
Year Ended December 31, 2011:
Interest rate swaps .......................................... $1,023 $(42) $ 1 $(10) $ 1
Interest rate forwards ........................................ 336 31 1 (1) 2
Foreign currency swaps ...................................... 175 — (6) 2 2
Credit forwards ............................................ 18 2 1 — —
Total ................................................... $1,552 $ (9) $(3) $ (9) $ 5
All components of each derivative’s gain or loss were included in the assessment of hedge effectiveness.
At December 31, 2013, ($23) million of deferred net gains (losses) on derivatives in AOCI was expected to be reclassified to earnings within the next
12 months.
Hedges of Net Investments in Foreign Operations
The Company uses foreign currency exchange rate derivatives, which may include foreign currency forwards and currency options, to hedge
portions of its net investments in foreign operations against adverse movements in exchange rates. The Company measures ineffectiveness on these
derivatives based upon the change in forward rates. In addition, the Company may also use non-derivative financial instruments to hedge portions of its
net investments in foreign operations against adverse movements in exchange rates. The Company measures ineffectiveness on non-derivative financial
instruments based upon the change in spot rates.
When net investments in foreign operations are sold or substantially liquidated, the amounts in AOCI are reclassified to the consolidated statements
of operations.
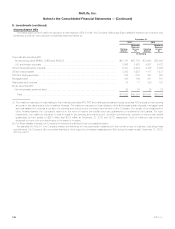
The following table presents the effects of derivatives and non-derivative financial instruments in net investment hedging relationships in the
consolidated statements of operations and the consolidated statements of equity:
Derivatives and Non-Derivative Hedging Instruments in Net
Investment Hedging Relationships (1), (2)
Amount of Gains (Losses) Deferred in AOCI
(Effective Portion)
Years Ended December 31,
2013 2012 2011
(In millions)
Foreign currency forwards .................................... $ 69 $(50) $62
Currency options ........................................... 262 36 —
Non-derivative hedging instruments ............................. — — 6
Total ................................................... $331 $(14) $68
(1) During the years ended December 31, 2013 and 2012, there were no sales or substantial liquidations of net investments in foreign operations that
would have required the reclassification of gains or losses from AOCI into earnings. During the year ended December 31, 2011, the Company sold
its interest in MSI MetLife, which was a hedged item in a net investment hedging relationship. As a result, the Company released losses of
$71 million from AOCI upon the sale. This release did not impact net income for the year ended December 31, 2011 as such losses were
considered in the overall impairment evaluation of the investment prior to sale. See Note 3.
(2) There was no ineffectiveness recognized for the Company’s hedges of net investments in foreign operations. All components of each derivative and
non-derivative hedging instrument’s gain or loss were included in the assessment of hedge effectiveness.
MetLife, Inc. 143