MetLife 2013 Annual Report Download - page 31
Download and view the complete annual report
Please find page 31 of the 2013 MetLife annual report below. You can navigate through the pages in the report by either clicking on the pages listed below, or by using the keyword search tool below to find specific information within the annual report.-
 1
1 -
2
-
3
-
4
-
5
-
6
-
7
-
8
-
9
-
10
-
11
-
12
-
13
-
14
-
15
-
16
-
17
-
18
-
19
-
20
-
 21
21 -
 22
22 -
 23
23 -
 24
24 -
 25
25 -
 26
26 -
 27
27 -
 28
28 -
 29
29 -
 30
30 -
 31
31 -
 32
32 -
 33
33 -
 34
34 -
 35
35 -
 36
36 -
 37
37 -
 38
38 -
 39
39 -
 40
40 -
 41
41 -
42
-
43
-
44
-
45
-
46
-
47
-
48
-
49
-
50
-
51
-
52
-
53
-
54
-
55
-
56
-
57
-
58
-
59
-
60
-
61
-
62
-
63
-
64
-
65
-
66
-
67
-
68
-
69
-
70
-
71
-
72
-
73
-
74
-
75
-
76
-
77
-
78
-
79
-
80
-
81
-
82
-
83
-
84
-
85
-
86
-
87
-
88
-
89
-
90
-
91
-
92
-
93
-
94
-
95
-
96
-
97
-
98
-
99
-
100
-
101
-
102
-
103
-
104
-
105
-
106
-
107
-
108
-
109
-
110
-
111
-
112
-
113
-
114
-
115
-
116
-
117
-
118
-
119
-
120
-
121
-
122
-
123
-
124
-
125
-
126
-
127
-
128
-
129
-
130
-
131
-
132
-
133
-
134
-
135
-
136
-
137
-
138
-
139
-
140
-
141
-
142
-
143
-
144
-
145
-
146
-
147
-
148
-
149
-
150
-
151
-
152
-
153
-
154
-
155
-
156
-
157
-
158
-
159
-
160
-
161
-
162
-
163
-
164
-
165
-
166
-
167
-
168
-
169
-
170
-
171
-
172
-
173
-
174
-
175
-
176
-
177
-
178
-
179
-
180
-
181
-
182
-
183
-
184
-
185
-
186
-
187
-
188
-
189
-
190
-
191
-
192
-
193
-
194
-
195
-
196
-
197
-
198
-
199
-
200
-
201
-
202
-
203
-
204
-
205
-
206
-
207
-
208
-
209
-
210
-
211
-
212
-
213
-
214
-
215
-
216
-
217
-
218
-
219
-
220
-
221
-
222
-
223
-
224
 |
 |

Year Ended December 31, 2012 Compared with the Year Ended December 31, 2011
During the year ended December 31, 2012, income (loss) from continuing operations, before provision for income tax, decreased $7.7 billion
($5.1 billion, net of income tax) from the year ended December 31, 2011 primarily driven by an unfavorable change in net derivative gains (losses) and
a goodwill impairment charge in 2012.
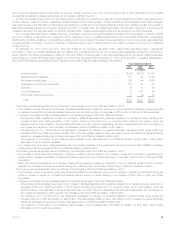
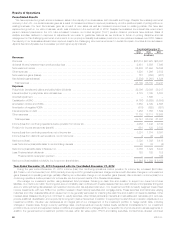
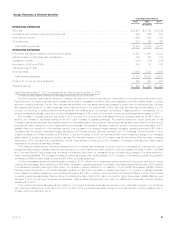
The variable annuity embedded derivatives and associated freestanding derivative hedges are collectively referred to as “VA program derivatives” in
the following table. All other derivatives that are economic hedges of certain invested assets and insurance liabilities are referred to as “non-VA program
derivatives” in the following table. The table below presents the impact on net derivative gains (losses) from non-VA program derivatives and VA
program derivatives:
Years Ended
December 31,
2012 2011
(In millions)
Non-VA program derivatives
Interest rate .......................................................................................... $ 271 $ 2,536
Foreign currency exchange rate .......................................................................... (426) 171
Credit .............................................................................................. (105) 173
Equity .............................................................................................. 1 6
Non-VA embedded derivatives ........................................................................... (61) 17
Total non-VA program derivatives ....................................................................... (320) 2,903
VA program derivatives
Market risks in embedded derivatives ...................................................................... 4,303 (2,332)
Nonperformance risk on embedded derivatives .............................................................. (1,659) 1,822
Other risks in embedded derivatives ...................................................................... (1,344) (791)
Total embedded derivatives ........................................................................... 1,300 (1,301)
Freestanding derivatives hedging embedded derivatives ....................................................... (2,899) 3,222
Total VA program derivatives ........................................................................... (1,599) 1,921
Net derivative gains (losses) ........................................................................... $(1,919) $ 4,824
The unfavorable change in net derivative gains (losses) on non-VA program derivatives was $3.2 billion ($2.1 billion, net of income tax). This was
primarily due to long-term interest rates increasing in 2012 but decreasing in 2011, unfavorably impacting receive-fixed interest rate swaps, long
interest rate floors and receiver swaptions. These freestanding derivatives are primarily hedging long duration liability portfolios. The weakening of the
U.S. dollar and Japanese yen relative to other key currencies unfavorably impacted foreign currency forwards and swaps, which primarily hedge certain
foreign denominated bonds. Additionally, the narrowing of credit spreads in 2012 compared to widening in 2011 unfavorably impacted credit default
swaps hedging certain bonds. Because certain of these hedging strategies are not designated or do not qualify as accounting hedges, the changes in
the estimated fair value of these freestanding derivatives are recognized in net derivative gains (losses) without an offsetting gain or loss recognized in
earnings for the item being hedged.
The unfavorable change in net derivative gains (losses) on VA program derivatives was $3.5 billion ($2.3 billion, net of income tax). This was due to
an unfavorable change of $3.5 billion ($2.3 billion, net of income tax) related to the change in the nonperformance risk adjustment on embedded
derivatives and an unfavorable change of $553 million ($359 million, net of income tax) related to the change in other risks on embedded derivatives,
partially offset by a favorable change of $514 million ($334 million, net of income tax) on market risks in embedded derivatives, net of the impact of
freestanding derivatives hedging those risks. Other risks relate primarily to the impact of policyholder behavior and other non-market risks that generally
cannot be hedged.
The $3.5 billion ($2.3 billion, net of income tax) unfavorable change in nonperformance risk from a gain of $1.8 billion ($1.2 billion, net of income
tax) in 2011 to a loss of $1.7 billion ($1.1 billion, net of income tax) in 2012 was due to changes in our own credit spread and the impact of capital
market inputs on the variable annuity guarantees. We calculate nonperformance risk as the change in the embedded derivative discounted at the risk
adjusted rate (which includes our own credit spread to the extent that the embedded derivative is in-the-money) less the change in the embedded
derivative discounted at the risk free rate. The nonperformance risk loss of $1.7 billion ($1.1 billion, net of income tax) in 2012 was due to a decrease
in our own credit spread, the increase in the long-term risk free interest rate, and the increase in key equity index levels. The nonperformance risk gain
of $1.8 billion ($1.2 billion, net of income tax) in 2011 was due to an increase in our own credit spread, the decrease in the long-term risk free interest
rate, and the decrease in key equity index levels.
The foregoing $553 million ($359 million, net of income tax) unfavorable change in other risks in embedded derivatives was primarily due to the
impact of foreign currency translation and the cross effect of capital market changes, which accounted for $600 million of this unfavorable change.
Other items contributing to this change included:
‰Refinements in the attribution analysis and valuation model, including periodic updates to actuarial assumptions and updates to better reflect
product features, which resulted in an unfavorable year over year change in the valuation of the embedded derivatives.
‰A decrease in the risk margin adjustment caused by lower policyholder behavior risks, which resulted in a favorable year over year change in the
valuation of the embedded derivatives.
‰A combination of other factors, such as in-force changes and the mismatch of fund performance between actual and modeled funds, which
resulted in a favorable year over year change in the valuation of the embedded derivatives.
The foregoing favorable change of $514 million ($334 million, net of income tax) is comprised of a $6.6 billion ($4.3 billion, net of income tax)
favorable change in market risks in our embedded derivatives, which was partially offset by a $6.1 billion ($4.0 billion, net of income tax) unfavorable
change in freestanding derivatives that hedge market risks in embedded derivatives. The primary changes in market factors are summarized as follows:
‰Long-term interest rates increased in 2012 but decreased in 2011 and contributed to an unfavorable change in our freestanding derivatives and
favorable changes in our embedded derivatives.
MetLife, Inc. 23