MetLife 2013 Annual Report Download - page 20
Download and view the complete annual report
Please find page 20 of the 2013 MetLife annual report below. You can navigate through the pages in the report by either clicking on the pages listed below, or by using the keyword search tool below to find specific information within the annual report.-
 1
1 -
2
-
3
-
4
-
5
-
6
-
7
-
8
-
9
-
 10
10 -
 11
11 -
 12
12 -
 13
13 -
 14
14 -
 15
15 -
 16
16 -
 17
17 -
 18
18 -
 19
19 -
 20
20 -
 21
21 -
 22
22 -
 23
23 -
 24
24 -
 25
25 -
 26
26 -
 27
27 -
 28
28 -
 29
29 -
 30
30 -
31
-
32
-
33
-
34
-
35
-
36
-
37
-
38
-
39
-
40
-
41
-
42
-
43
-
44
-
45
-
46
-
47
-
48
-
49
-
50
-
51
-
52
-
53
-
54
-
55
-
56
-
57
-
58
-
59
-
60
-
61
-
62
-
63
-
64
-
65
-
66
-
67
-
68
-
69
-
70
-
71
-
72
-
73
-
74
-
75
-
76
-
77
-
78
-
79
-
80
-
81
-
82
-
83
-
84
-
85
-
86
-
87
-
88
-
89
-
90
-
91
-
92
-
93
-
94
-
95
-
96
-
97
-
98
-
99
-
100
-
101
-
102
-
103
-
104
-
105
-
106
-
107
-
108
-
109
-
110
-
111
-
112
-
113
-
114
-
115
-
116
-
117
-
118
-
119
-
120
-
121
-
122
-
123
-
124
-
125
-
126
-
127
-
128
-
129
-
130
-
131
-
132
-
133
-
134
-
135
-
136
-
137
-
138
-
139
-
140
-
141
-
142
-
143
-
144
-
145
-
146
-
147
-
148
-
149
-
150
-
151
-
152
-
153
-
154
-
155
-
156
-
157
-
158
-
159
-
160
-
161
-
162
-
163
-
164
-
165
-
166
-
167
-
168
-
169
-
170
-
171
-
172
-
173
-
174
-
175
-
176
-
177
-
178
-
179
-
180
-
181
-
182
-
183
-
184
-
185
-
186
-
187
-
188
-
189
-
190
-
191
-
192
-
193
-
194
-
195
-
196
-
197
-
198
-
199
-
200
-
201
-
202
-
203
-
204
-
205
-
206
-
207
-
208
-
209
-
210
-
211
-
212
-
213
-
214
-
215
-
216
-
217
-
218
-
219
-
220
-
221
-
222
-
223
-
224
 |
 |

to 3.0%, all of which are currently at their respective minimum interest crediting rates. While we expect to experience margin compression as we re-
invest at lower rates, the interest rate derivatives held in this portfolio will partially mitigate this risk.
Annuities – The impact on operating earnings from margin compression is concentrated in our deferred annuities where there are minimum
interest rate guarantees. Under low U.S. interest rate scenarios, we assume that a larger percentage of customers will maintain their funds with us
to take advantage of the attractive minimum guaranteed crediting rates and we expect to experience margin compression as we reinvest cash
flows at lower interest rates. Partially offsetting this margin compression, we assume we will lower crediting rates on contractual reset dates for the
portion of business that is not currently at minimum crediting rates. Additionally, we have various derivative positions, primarily interest rate floors, to
partially mitigate this risk.
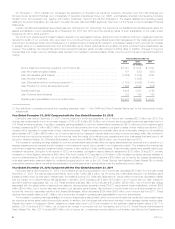
Reinvestment risk is defined for this purpose as the amount of reinvestment in 2014 and 2015 that would impact operating earnings due to
reinvesting cash flows in the hypothetical U.S. interest rate stress scenario. For the deferred annuities business, $3.1 billion and $2.7 billion in 2014
and 2015, respectively, of the asset base will be subject to reinvestment risk on an average asset base of $35.6 billion and $36.1 billion in 2014
and 2015, respectively.
We estimate an unfavorable operating earnings impact on our Retail segment from the hypothetical U.S. interest rate stress scenario discussed
above of $30 million and $60 million in 2014 and 2015, respectively.
Group, Voluntary & Worksite Benefits
Group – In general, most of our group life insurance products in this segment are renewable term insurance and, therefore, have significant
repricing flexibility. Interest rate risk arises mainly from minimum interest rate guarantees on retained asset accounts. These accounts have minimum
interest crediting rate guarantees which range from 0.5% to 3.0%. All of these account balances are currently at their respective minimum interest
crediting rates and we would expect to experience margin compression as we reinvest at lower interest rates. We have used interest rate floors to
partially mitigate the risks of a sustained U.S. low interest rate environment. We also have exposure to interest rate risk in this business arising from
our group disability policy claim reserves. For these products, lower reinvestment rates cannot be offset by a reduction in liability crediting rates for
established claim reserves. Group disability policies are generally renewable term policies. Rates may be adjusted on in-force policies at renewal
based on the retrospective experience rating and current interest rate assumptions. We review the discount rate assumptions and other
assumptions associated with our long-term disability claim reserves no less frequently than annually. Our most recent review at the end of 2013
resulted in no change to the applicable discount rates.
Voluntary & Worksite – We have exposure to interest rate risk in this business arising mainly from our long-term care (“LTC”) policy reserves. For
these products, lower reinvestment rates cannot be offset by a reduction in liability crediting rates for established claim reserves. LTC policies are
generally renewable, and rates may be adjusted on a class basis with regulatory approval to reflect emerging experience. Our LTC block is closed
to new business. The Company makes use of derivative instruments to more closely match asset and liability duration and immunize the portfolio
against changes in interest rates. Reinvestment risk is defined for this purpose as the amount of reinvestment in 2014 and 2015 that would impact
operating earnings due to reinvesting cash flows in the hypothetical U.S. interest rate stress scenario. For the LTC portfolio, $976 million and $906
million of the asset base in both 2014 and 2015 will be subject to reinvestment risk on an average asset base of $9.1 billion and $9.9 billion in
2014 and 2015, respectively.
We estimate an unfavorable operating earnings impact on our Group, Voluntary & Worksite Benefits segment from the hypothetical U.S. interest
rate stress scenario discussed above of $5 million and $20 million in 2014 and 2015, respectively.
Corporate Benefit Funding
This segment contains both short and long duration products consisting of capital market products, pension closeouts, structured settlements,
and other benefit funding products. The majority of short duration products are managed on a floating rate basis, which mitigates the impact of the
low interest rate environment in the U.S. The long duration products have very predictable cash flows and we have matched these cash flows
through our ALM strategies. We also use interest rate swaps to help protect income in this segment against a low interest rate environment in the
U.S. Based on the cash flow estimates, only a small component is subject to reinvestment risk. Reinvestment risk is defined for this purpose as the
amount of reinvestment in 2014 and 2015 that would impact operating earnings due to reinvesting cash flows in the hypothetical interest rate
stress scenario. For the long duration business, none of the asset base in 2014 and 2015 will be subject to reinvestment risk on an average asset
base of $47.1 billion and $48.0 billion in 2014 and 2015, respectively.
We estimate minimal operating earnings impact on our Corporate Benefit Funding segment from the hypothetical U.S. interest rate stress
scenario discussed above in 2014 and 2015.
Asia
Our Asia segment has a portion of its investments in U.S. dollar denominated assets. The following describes the impact on our Asia segment’s
operating earnings under the hypothetical U.S. interest rate stress scenario.
Life & Other – Our Japan business offers traditional life insurance and accident & health products. To the extent the Japan life insurance
portfolio is U.S. interest rate sensitive and we are unable to lower crediting rates to the customer, operating earnings will decline. We manage
interest rate risk on our life products through a combination of product design features and ALM strategies.
Annuities – We sell annuities in Asia which are predominantly single premium products with crediting rates set at the time of issue. This allows
us to tightly manage product ALM, cash flows and net spreads, thus maintaining profitability.
We estimate an unfavorable operating earnings impact on our Asia segment from the hypothetical U.S. interest rate stress scenario discussed
above of $10 million and $35 million in 2014 and 2015, respectively.
Corporate & Other
Corporate & Other contains the surplus portfolios for the enterprise, the portfolios used to fund the capital needs of the Company and various
reinsurance products. The surplus portfolios are subject to reinvestment risk; however, lower net investment income is significantly offset by lower
interest expense on both fixed and variable rate debt. Under a lower interest rate environment, fixed rate debt is assumed to be either paid off when
it matures or refinanced at a lower interest rate resulting in lower overall interest expense. Variable rate debt is indexed to the three-month London
Interbank Offered Rate (“LIBOR”), which results in lower interest expense incurred.
We estimate an unfavorable operating earnings impact on Corporate & Other from the hypothetical U.S. interest rate stress scenario discussed
above of $30 million and $90 million in 2014 and 2015, respectively.
12 MetLife, Inc.