MetLife 2013 Annual Report Download - page 39
Download and view the complete annual report
Please find page 39 of the 2013 MetLife annual report below. You can navigate through the pages in the report by either clicking on the pages listed below, or by using the keyword search tool below to find specific information within the annual report.-
 1
1 -
2
-
3
-
4
-
5
-
6
-
7
-
8
-
9
-
10
-
11
-
12
-
13
-
14
-
15
-
16
-
17
-
18
-
19
-
20
-
21
-
22
-
23
-
24
-
25
-
26
-
27
-
28
-
 29
29 -
 30
30 -
 31
31 -
 32
32 -
 33
33 -
 34
34 -
 35
35 -
 36
36 -
 37
37 -
 38
38 -
 39
39 -
 40
40 -
 41
41 -
 42
42 -
 43
43 -
 44
44 -
 45
45 -
 46
46 -
 47
47 -
 48
48 -
 49
49 -
50
-
51
-
52
-
53
-
54
-
55
-
56
-
57
-
58
-
59
-
60
-
61
-
62
-
63
-
64
-
65
-
66
-
67
-
68
-
69
-
70
-
71
-
72
-
73
-
74
-
75
-
76
-
77
-
78
-
79
-
80
-
81
-
82
-
83
-
84
-
85
-
86
-
87
-
88
-
89
-
90
-
91
-
92
-
93
-
94
-
95
-
96
-
97
-
98
-
99
-
100
-
101
-
102
-
103
-
104
-
105
-
106
-
107
-
108
-
109
-
110
-
111
-
112
-
113
-
114
-
115
-
116
-
117
-
118
-
119
-
120
-
121
-
122
-
123
-
124
-
125
-
126
-
127
-
128
-
129
-
130
-
131
-
132
-
133
-
134
-
135
-
136
-
137
-
138
-
139
-
140
-
141
-
142
-
143
-
144
-
145
-
146
-
147
-
148
-
149
-
150
-
151
-
152
-
153
-
154
-
155
-
156
-
157
-
158
-
159
-
160
-
161
-
162
-
163
-
164
-
165
-
166
-
167
-
168
-
169
-
170
-
171
-
172
-
173
-
174
-
175
-
176
-
177
-
178
-
179
-
180
-
181
-
182
-
183
-
184
-
185
-
186
-
187
-
188
-
189
-
190
-
191
-
192
-
193
-
194
-
195
-
196
-
197
-
198
-
199
-
200
-
201
-
202
-
203
-
204
-
205
-
206
-
207
-
208
-
209
-
210
-
211
-
212
-
213
-
214
-
215
-
216
-
217
-
218
-
219
-
220
-
221
-
222
-
223
-
224
 |
 |

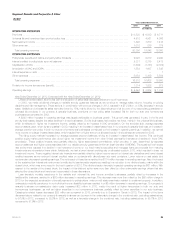
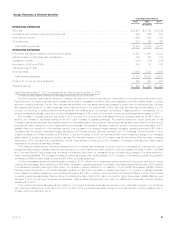
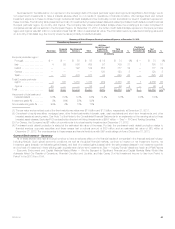
Group, Voluntary & Worksite Benefits
Years Ended December 31,
2013 2012 2011
(In millions)
OPERATING REVENUES
Premiums .................................................................................... $15,250 $14,794 $13,949
Universal life and investment-type product policy fees .................................................. 688 662 630
Net investment income .......................................................................... 1,856 1,768 1,768
Other revenues ................................................................................ 418 422 390
Total operating revenues ...................................................................... 18,212 17,646 16,737
OPERATING EXPENSES
Policyholder benefits and claims and policyholder dividends ............................................. 14,227 13,691 13,015
Interest credited to policyholder account balances .................................................... 155 167 178
Capitalization of DAC ........................................................................... (141) (138) (176)
Amortization of DAC and VOBA ................................................................... 140 133 186
Interest expense on debt ........................................................................ 1 1 —
Other expenses ............................................................................... 2,380 2,351 2,198
Total operating expenses ...................................................................... 16,762 16,205 15,401
Provision for income tax expense (benefit) ........................................................... 488 481 445
Operating earnings ............................................................................. $ 962 $ 960 $ 891
Year Ended December 31, 2013 Compared with the Year Ended December 31, 2012
Unless otherwise stated, all amounts discussed below are net of income tax.
Economic recovery has remained slow and unsteady, although we continue to see signs of improvement to the macro-economic environment.
Premiums from our dental business have increased as a result of increased enrollment, improved persistency, and the positive impact of pricing
actions on existing business. Our term life business has benefited from new sales, as well as increased covered lives on existing policies. We have
also experienced growth in our vision business, which was introduced in the second half of 2012. Although we have discontinued selling our LTC
product, we continue to collect premiums and administer the existing block of business, contributing to asset growth in the segment. In our
property & casualty business, premiums on new policy sales increased 27% for both our auto and homeowners businesses as compared to 2012.
The increase in average premium per policy in both our auto and homeowners businesses improved operating earnings by $44 million. In
addition, an increase in exposures resulted in an $11 million increase in operating earnings. The positive impact from higher premiums on this
increase in exposures exceeded the negative impact from the related claims. Exposures are defined generally as each automobile for the auto line of
business and each residence for the homeowners line of business. An increase in allocated equity and growth in premiums and deposits in 2013,
partially offset by a reduction in other liabilities, resulted in an increase in our average invested assets, increasing operating earnings by $34 million.
Consistent with the growth in average invested assets from 2013 premiums and deposits, primarily in our LTC business, interest credited on long-
duration contracts and PABs increased by $19 million. In the fourth quarter of 2012, we recorded a $50 million impairment charge on an intangible
asset related to a previously acquired dental business. The favorable impact of this 2012 charge was almost entirely offset by higher operating
expenses in 2013, primarily from postretirement benefit costs across the segment and an increase in marketing, advertising and sales-related
expenses in our property & casualty business.
The impact of market factors, including increased income on interest rate derivatives, improved returns on real estate joint ventures and higher
prepayment fees received, partially offset by lower returns on our fixed maturity securities, resulted in improved investment yields. Unlike in the Retail
and Corporate Benefit Funding segments, a change in investment yield does not necessarily drive a corresponding change in the rates credited on
certain insurance liabilities. The increase in investment yields, as well as lower crediting rates in 2013, the result of the maturity of certain long-duration
contracts and PABs at higher rates, contributed $33 million to operating earnings.
Our life businesses experienced less favorable mortality in 2013, mainly due to unfavorable claims experience in the group term life and group
universal life businesses, which resulted in a $46 million decrease in operating earnings. The impact of favorable reserve refinements in 2012 resulted
in a decrease in operating earnings of $23 million. An increase in claims incidence in our disability, LTC and AD&D businesses, partially offset by
favorable claims experience in our dental business, resulted in a $42 million decrease in operating earnings. In our property & casualty business,
lower catastrophe-related losses improved operating earnings by $43 million, primarily due to the impact of Superstorm Sandy in 2012. This increase
in operating earnings was partially offset by higher non-catastrophe claim costs of $18 million, the result of higher frequencies, partially offset by lower
severities, in both our auto and homeowners businesses. Less favorable development of prior year non-catastrophe losses also reduced operating
results by $13 million.
The impact of the items discussed above related to our property & casualty business can be seen in the unfavorable change in the combined
ratio, excluding catastrophes, to 90.7% in 2013 from 88.7% in 2012, as well as a favorable change in the combined ratio, including catastrophes, to
93.6% in 2013 from 96.5% in 2012.
MetLife, Inc. 31