MetLife 2013 Annual Report Download - page 35
Download and view the complete annual report
Please find page 35 of the 2013 MetLife annual report below. You can navigate through the pages in the report by either clicking on the pages listed below, or by using the keyword search tool below to find specific information within the annual report.-
 1
1 -
2
-
3
-
4
-
5
-
6
-
7
-
8
-
9
-
10
-
11
-
12
-
13
-
14
-
15
-
16
-
17
-
18
-
19
-
20
-
21
-
22
-
23
-
24
-
 25
25 -
 26
26 -
 27
27 -
 28
28 -
 29
29 -
 30
30 -
 31
31 -
 32
32 -
 33
33 -
 34
34 -
 35
35 -
 36
36 -
 37
37 -
 38
38 -
 39
39 -
 40
40 -
 41
41 -
 42
42 -
 43
43 -
 44
44 -
 45
45 -
46
-
47
-
48
-
49
-
50
-
51
-
52
-
53
-
54
-
55
-
56
-
57
-
58
-
59
-
60
-
61
-
62
-
63
-
64
-
65
-
66
-
67
-
68
-
69
-
70
-
71
-
72
-
73
-
74
-
75
-
76
-
77
-
78
-
79
-
80
-
81
-
82
-
83
-
84
-
85
-
86
-
87
-
88
-
89
-
90
-
91
-
92
-
93
-
94
-
95
-
96
-
97
-
98
-
99
-
100
-
101
-
102
-
103
-
104
-
105
-
106
-
107
-
108
-
109
-
110
-
111
-
112
-
113
-
114
-
115
-
116
-
117
-
118
-
119
-
120
-
121
-
122
-
123
-
124
-
125
-
126
-
127
-
128
-
129
-
130
-
131
-
132
-
133
-
134
-
135
-
136
-
137
-
138
-
139
-
140
-
141
-
142
-
143
-
144
-
145
-
146
-
147
-
148
-
149
-
150
-
151
-
152
-
153
-
154
-
155
-
156
-
157
-
158
-
159
-
160
-
161
-
162
-
163
-
164
-
165
-
166
-
167
-
168
-
169
-
170
-
171
-
172
-
173
-
174
-
175
-
176
-
177
-
178
-
179
-
180
-
181
-
182
-
183
-
184
-
185
-
186
-
187
-
188
-
189
-
190
-
191
-
192
-
193
-
194
-
195
-
196
-
197
-
198
-
199
-
200
-
201
-
202
-
203
-
204
-
205
-
206
-
207
-
208
-
209
-
210
-
211
-
212
-
213
-
214
-
215
-
216
-
217
-
218
-
219
-
220
-
221
-
222
-
223
-
224
 |
 |

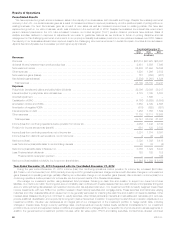
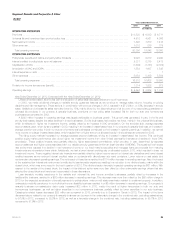
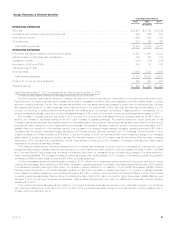
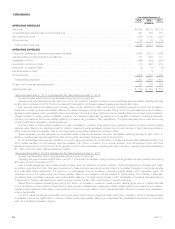
Consolidated Results – Operating
Years Ended December 31,
2013 2012 2011
(In millions)
OPERATING REVENUES
Premiums .................................................................................... $37,675 $37,911 $36,269
Universal life and investment-type product policy fees .................................................. 9,085 8,212 7,528
Net investment income .......................................................................... 20,584 20,472 19,638
Other revenues ................................................................................ 1,954 1,756 1,652
Total operating revenues ...................................................................... 69,298 68,351 65,087
OPERATING EXPENSES
Policyholder benefits and claims and policyholder dividends ............................................. 37,968 37,770 36,241
Interest credited to policyholder account balances .................................................... 6,015 6,242 6,057
Capitalization of DAC ........................................................................... (4,786) (5,284) (5,549)
Amortization of DAC and VOBA ................................................................... 4,083 4,177 4,355
Amortization of negative VOBA .................................................................... (524) (555) (619)
Interest expense on debt ........................................................................ 1,159 1,190 1,304
Other expenses ............................................................................... 16,615 16,680 16,620
Total operating expenses ...................................................................... 60,530 60,220 58,409
Provision for income tax expense (benefit) ........................................................... 2,359 2,323 1,879
Operating earnings ............................................................................. 6,409 5,808 4,799
Less: Preferred stock dividends ................................................................... 122 122 122
Operating earnings available to common shareholders ................................................. $ 6,287 $ 5,686 $ 4,677
Year Ended December 31, 2013 Compared with the Year Ended December 31, 2012
Unless otherwise stated, all amounts discussed below are net of income tax.
The primary drivers of the increase in operating earnings were higher asset-based fee revenues, higher net investment income from portfolio growth
and lower interest credited expenses, partially offset by lower yields and an increase in operating expenses. During the fourth quarter of 2013, we
increased our litigation reserve related to asbestos by $101 million. During 2013, we also increased our other litigation reserves by $46 million. The
fourth quarter 2013 acquisition of ProVida in Chile increased operating earnings by $48 million. In addition, the year ended December 31, 2012
included a $52 million charge representing a multi-state examination payment related to unclaimed property and our use of the U.S. Social Security
Administration’s Death Master File to identify potential life insurance claims, as well as the acceleration of benefit payments to policyholders under the
settlements of such claims. Changes in foreign currency exchange rates had a $58 million negative impact on results compared to 2012.
We benefited from strong sales, as well as growth and higher persistency, in our business across many of our products. In 2013, we made
additional changes to variable annuity guarantee features which, in combination with product changes made in 2012, resulted in a significant decrease
in variable annuity sales in our Retail segment. The demand for foreign currency-denominated fixed annuity products in Japan also declined as a result
of a weakening yen and a sharp increase in equity markets, which decreased sales. However, as a result of significant positive net flows in our Retail
segment since 2012, we experienced growth in our average separate account assets. This, combined with an increase in surrenders in Japan driven
by market conditions, generated higher policy fee income of $382 million. Deposits and funding agreement issuances in 2013 in our Corporate Benefit
Funding segment, combined with positive net flows from our universal life business resulted in growth in our investment portfolio which generated
higher net investment income of $413 million. This increase in net investment income was partially offset by a $169 million corresponding increase in
interest credited on certain liabilities, most notably in the Corporate Benefit Funding segment. A decrease in commissions, which was primarily driven
by the decline in annuity sales, was partially offset by a decrease in related DAC capitalization, which combined, resulted in a $103 million increase in
operating earnings. An increase in average premium per policy, coupled with an increase in exposures in our property & casualty businesses resulted
in a $106 million increase in operating earnings. Overall business growth was the primary driver of higher DAC amortization of $302 million in 2013. In
our international segments, higher premiums were more than offset by higher policyholder benefits and operating expenses, resulting in a $123 million
decrease in operating earnings.
Market factors, including the sustained low interest rate environment, continued to impact our investment yields, as well as our crediting rates.
Excluding the results of the Divested Business and the impact of inflation-indexed investments in the Latin America segment, investment yields
declined. Certain of our inflation-indexed products are backed by inflation-indexed investments. Changes in inflation cause fluctuations in net
investment income with a corresponding fluctuation in policyholder benefits, resulting in a minimal impact to operating earnings. Yield changes were
primarily driven by the impact of the low interest rate environment on fixed maturity securities and mortgage loans and from lower returns on real estate
joint ventures. These declines were partially offset by higher income on interest rate derivatives, improved returns on other limited partnership interests
and the favorable impact of the continued repositioning of the Japan portfolio to higher yielding investments. A significant portion of these derivatives
was entered into prior to the onset of the current low interest rate environment to mitigate the risk of low interest rates in the U.S. The low interest rate
environment also resulted in lower interest credited expense as we set interest credited rates lower on both new business and certain in-force
business with rate resets that are contractually tied to external indices or contain discretionary rate reset provisions. Our average separate account
balance grew with the equity markets driving higher fee income in our annuity business. This continued positive equity market performance also
resulted in lower DAC amortization. The changes in market factors discussed above resulted in a $263 million increase in operating earnings.
MetLife, Inc. 27