Capital One 2015 Annual Report Download - page 98
Download and view the complete annual report
Please find page 98 of the 2015 Capital One annual report below. You can navigate through the pages in the report by either clicking on the pages listed below, or by using the keyword search tool below to find specific information within the annual report.-
 1
1 -
2
-
3
-
4
-
5
-
6
-
7
-
8
-
9
-
10
-
11
-
12
-
13
-
14
-
15
-
16
-
17
-
18
-
19
-
20
-
21
-
22
-
23
-
24
-
25
-
26
-
27
-
28
-
29
-
30
-
31
-
32
-
33
-
34
-
35
-
36
-
37
-
38
-
39
-
40
-
41
-
42
-
43
-
44
-
45
-
46
-
47
-
48
-
49
-
50
-
51
-
52
-
53
-
54
-
55
-
56
-
57
-
58
-
59
-
60
-
61
-
62
-
63
-
64
-
65
-
66
-
67
-
68
-
69
-
70
-
71
-
72
-
73
-
74
-
75
-
76
-
77
-
78
-
79
-
80
-
81
-
82
-
83
-
84
-
85
-
86
-
87
-
 88
88 -
 89
89 -
 90
90 -
 91
91 -
 92
92 -
 93
93 -
 94
94 -
 95
95 -
 96
96 -
 97
97 -
 98
98 -
 99
99 -
 100
100 -
 101
101 -
 102
102 -
 103
103 -
 104
104 -
 105
105 -
 106
106 -
 107
107 -
 108
108 -
109
-
110
-
111
-
112
-
113
-
114
-
115
-
116
-
117
-
118
-
119
-
120
-
121
-
122
-
123
-
124
-
125
-
126
-
127
-
128
-
129
-
130
-
131
-
132
-
133
-
134
-
135
-
136
-
137
-
138
-
139
-
140
-
141
-
142
-
143
-
144
-
145
-
146
-
147
-
148
-
149
-
150
-
151
-
152
-
153
-
154
-
155
-
156
-
157
-
158
-
159
-
160
-
161
-
162
-
163
-
164
-
165
-
166
-
167
-
168
-
169
-
170
-
171
-
172
-
173
-
174
-
175
-
176
-
177
-
178
-
179
-
180
-
181
-
182
-
183
-
184
-
185
-
186
-
187
-
188
-
189
-
190
-
191
-
192
-
193
-
194
-
195
-
196
-
197
-
198
-
199
-
200
-
201
-
202
-
203
-
204
-
205
-
206
-
207
-
208
-
209
-
210
-
211
-
212
-
213
-
214
-
215
-
216
-
217
-
218
-
219
-
220
-
221
-
222
-
223
-
224
-
225
-
226
-
227
-
228
-
229
-
230
-
231
-
232
-
233
-
234
-
235
-
236
-
237
-
238
-
239
-
240
-
241
-
242
-
243
-
244
-
245
-
246
-
247
-
248
-
249
-
250
-
251
-
252
-
253
 |
 |

79 Capital One Financial Corporation (COF)
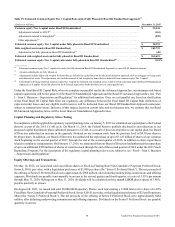
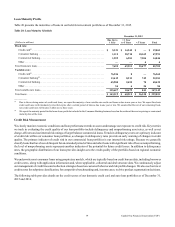
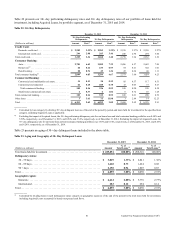
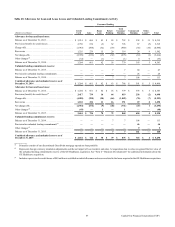
Loan Maturity Profile
Table 20 presents the maturities of loans in our held-for-investment portfolio as of December 31, 2015.
Table 20: Loan Maturity Schedule
December 31, 2015
(Dollars in millions)
Due Up to
1 Year
> 1 Year
to 5 Years > 5 Years Total
Fixed rate:
Credit card(1) . . . . . . . . . . . . . . . . . . . . . . . . . . . . . . . . . . . . . . . . . . . . . . . . . . . . . . . . $ 5,321 $ 14,542 $ — $ 19,863
Consumer banking . . . . . . . . . . . . . . . . . . . . . . . . . . . . . . . . . . . . . . . . . . . . . . . . . . . 1,112 28,710 18,169 47,991
Commercial banking. . . . . . . . . . . . . . . . . . . . . . . . . . . . . . . . . . . . . . . . . . . . . . . . . . 1,259 6,281 7,304 14,844
Other . . . . . . . . . . . . . . . . . . . . . . . . . . . . . . . . . . . . . . . . . . . . . . . . . . . . . . . . . . . . . . — — 4 4
Total fixed-rate loans . . . . . . . . . . . . . . . . . . . . . . . . . . . . . . . . . . . . . . . . . . . . . . . . . . . . 7,692 49,533 25,477 82,702
Variable rate:
Credit card(1) . . . . . . . . . . . . . . . . . . . . . . . . . . . . . . . . . . . . . . . . . . . . . . . . . . . . . . . . 76,254 8 — 76,262
Consumer banking(2) . . . . . . . . . . . . . . . . . . . . . . . . . . . . . . . . . . . . . . . . . . . . . . . . . . 13,419 8,213 749 22,381
Commercial banking. . . . . . . . . . . . . . . . . . . . . . . . . . . . . . . . . . . . . . . . . . . . . . . . . . 45,900 2,452 70 48,422
Other . . . . . . . . . . . . . . . . . . . . . . . . . . . . . . . . . . . . . . . . . . . . . . . . . . . . . . . . . . . . . . 54 6 24 84
Total variable-rate loans. . . . . . . . . . . . . . . . . . . . . . . . . . . . . . . . . . . . . . . . . . . . . . . . . . 135,627 10,679 843 147,149
Total loans . . . . . . . . . . . . . . . . . . . . . . . . . . . . . . . . . . . . . . . . . . . . . . . . . . . . . . . . . . . . $ 143,319 $ 60,212 $ 26,320 $ 229,851
__________
(1) Due to the revolving nature of credit card loans, we report the majority of our variable-rate credit card loans as due in one year or less. We report fixed-rate
credit card loans with introductory rates that expire after a certain period of time as due in one year or less. We assume that the rest of our remaining fixed-
rate credit card loans will mature within one to three years.
(2) We report the maturity period for the home loans portfolio included in the Consumer Banking business based on the earlier of the next re-pricing or contractual
maturity date of the loan.
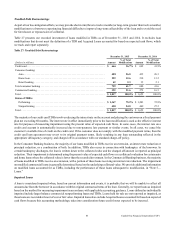
Credit Risk Measurement
We closely monitor economic conditions and loan performance trends to assess and manage our exposure to credit risk. Key metrics
we track in evaluating the credit quality of our loan portfolio include delinquency and nonperforming asset rates, as well as net
charge-off rates and our internal risk ratings of larger balance commercial loans. Trends in delinquency rates are a primary indicator
of credit risk within our consumer loan portfolios, as changes in delinquency rates provide an early warning of changes in credit
quality. The primary indicator of credit risk in our commercial loan portfolios is our internal risk ratings. Because we generally
classify loans that have been delinquent for an extended period of time and other loans with significant risk of loss as nonperforming,
the level of nonperforming assets represents another indicator of the potential for future credit losses. In addition to delinquency
rates, the geographic distribution of our loans provides insight as to the credit quality of the portfolio based on regional economic
conditions.
We underwrite most consumer loans using proprietary models, which are typically based on credit bureau data, including borrower
credit scores, along with application information and, where applicable, collateral and deal structure data. We continuously adjust
our management of credit lines and collection strategies based on customer behavior and risk profile changes. We also use borrower
credit scores for subprime classification, for competitive benchmarking and, in some cases, to drive product segmentation decisions.
The following table provides details on the credit scores of our domestic credit card and auto loan portfolios as of December 31,
2015 and 2014.