Capital One 2015 Annual Report Download - page 61
Download and view the complete annual report
Please find page 61 of the 2015 Capital One annual report below. You can navigate through the pages in the report by either clicking on the pages listed below, or by using the keyword search tool below to find specific information within the annual report.-
 1
1 -
2
-
3
-
4
-
5
-
6
-
7
-
8
-
9
-
10
-
11
-
12
-
13
-
14
-
15
-
16
-
17
-
18
-
19
-
20
-
21
-
22
-
23
-
24
-
25
-
26
-
27
-
28
-
29
-
30
-
31
-
32
-
33
-
34
-
35
-
36
-
37
-
38
-
39
-
40
-
41
-
42
-
43
-
44
-
45
-
46
-
47
-
48
-
49
-
50
-
 51
51 -
 52
52 -
 53
53 -
 54
54 -
 55
55 -
 56
56 -
 57
57 -
 58
58 -
 59
59 -
 60
60 -
 61
61 -
 62
62 -
 63
63 -
 64
64 -
 65
65 -
 66
66 -
 67
67 -
 68
68 -
 69
69 -
 70
70 -
 71
71 -
72
-
73
-
74
-
75
-
76
-
77
-
78
-
79
-
80
-
81
-
82
-
83
-
84
-
85
-
86
-
87
-
88
-
89
-
90
-
91
-
92
-
93
-
94
-
95
-
96
-
97
-
98
-
99
-
100
-
101
-
102
-
103
-
104
-
105
-
106
-
107
-
108
-
109
-
110
-
111
-
112
-
113
-
114
-
115
-
116
-
117
-
118
-
119
-
120
-
121
-
122
-
123
-
124
-
125
-
126
-
127
-
128
-
129
-
130
-
131
-
132
-
133
-
134
-
135
-
136
-
137
-
138
-
139
-
140
-
141
-
142
-
143
-
144
-
145
-
146
-
147
-
148
-
149
-
150
-
151
-
152
-
153
-
154
-
155
-
156
-
157
-
158
-
159
-
160
-
161
-
162
-
163
-
164
-
165
-
166
-
167
-
168
-
169
-
170
-
171
-
172
-
173
-
174
-
175
-
176
-
177
-
178
-
179
-
180
-
181
-
182
-
183
-
184
-
185
-
186
-
187
-
188
-
189
-
190
-
191
-
192
-
193
-
194
-
195
-
196
-
197
-
198
-
199
-
200
-
201
-
202
-
203
-
204
-
205
-
206
-
207
-
208
-
209
-
210
-
211
-
212
-
213
-
214
-
215
-
216
-
217
-
218
-
219
-
220
-
221
-
222
-
223
-
224
-
225
-
226
-
227
-
228
-
229
-
230
-
231
-
232
-
233
-
234
-
235
-
236
-
237
-
238
-
239
-
240
-
241
-
242
-
243
-
244
-
245
-
246
-
247
-
248
-
249
-
250
-
251
-
252
-
253
 |
 |
42 Capital One Financial Corporation (COF)
determined as the excess of the fair value of the consideration transferred, plus the fair value of any non-controlling interests in
the acquiree, over the fair value of the net assets acquired and liabilities assumed as of the acquisition date.
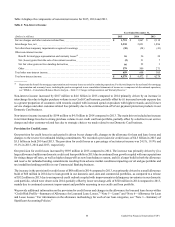
Goodwill totaled $14.5 billion and $14.0 billion as of December 31, 2015 and 2014, respectively. The increase was primarily
attributable to $500 million of goodwill recognized as part of the GE Healthcare acquisition. See “Note 2—Business Developments”
for additional information. Intangible assets, which we report on our consolidated balance sheets as a component of other assets,
consist primarily of purchased credit card relationships (“PCCR”) and core deposit intangibles. The net carrying amount of
intangible assets decreased to $1.0 billion as of December 31, 2015, from $1.3 billion as of December 31, 2014. Goodwill and
intangible assets together represented 5% of our total assets as of both December 31, 2015 and 2014. We did not recognize material
impairment on goodwill or intangible assets in 2015, 2014 or 2013.
Goodwill
Goodwill is not amortized but is tested for impairment at the reporting unit level, on an annual basis or in interim periods if events
or circumstances indicate potential impairment. A reporting unit is an operating segment or one level below. The goodwill
impairment test, performed as of October 1 of each year, is a two-step test. The first step identifies whether there is potential
impairment by comparing the fair value of each reporting unit to its carrying amount, including goodwill. If the fair value of a
reporting unit is less than its carrying amount, the second step of the impairment test is required to measure the amount of any
potential impairment loss.
Estimating the fair value of reporting units and the assets, liabilities and intangible assets of a reporting unit is a subjective process
that involves the use of estimates and judgments. The fair value of reporting units is calculated using a discounted cash flow
calculation, a form of the income approach. The calculation uses projected cash flows based on each reporting unit’s internal
forecast and the perpetuity growth method to calculate terminal values. These cash flows and terminal values are then discounted
using discount rates based on our external cost of equity with adjustments for risk inherent in each reporting unit. Cash flows are
adjusted, as necessary, in order to maintain each reporting unit’s equity capital requirements. Our discounted cash flow analysis
requires management to make judgments about future loan and deposit growth, revenue growth, credit losses, and capital rates.
Discount rates used in 2015 for the reporting units ranged from 8% to 13%. The key inputs into the discounted cash flow analysis
were consistent with market data, where available, indicating that assumptions used were within a reasonable range of observable
market data.
We calculate the carrying amounts of our reporting units using an allocated capital approach based on each reporting unit’s specific
regulatory capital, economic capital requirements, and underlying risks. The total of the reporting unit carrying amount for the
October 1, 2015 annual goodwill impairment test was $35.1 billion, compared to consolidated equity of $47.7 billion as of
September 30, 2015. Of the $12.6 billion remaining equity, $8.2 billion was primarily attributable to the following items: capital
allocated to our Other category, preferred stock, and capital that was reserved for dividends and share buy-backs that occurred
during the fourth quarter of 2015. The remaining unallocated equity of approximately $4.4 billion, which represented approximately
9% of our total equity, has been reserved for potential future capital needs.
We compare the total reporting unit carrying amounts to our total consolidated stockholders’ equity to assess the appropriateness
of our methodology. If the second step of goodwill impairment testing is required for a reporting unit, we would undertake an
extensive effort to build the specific reporting unit’s balance sheet for the test based on applicable accounting guidance. Based on
our analysis, the current fair value exceeded the carrying amount of all reporting units as of our annual testing date; therefore, the
second step of impairment testing was unnecessary.
Intangible Assets
Intangible assets with definitive useful lives are amortized over their estimated lives and evaluated for potential impairment
whenever events or changes in circumstances suggest that an asset’s or asset group’s carrying amount may not be fully recoverable.
An impairment loss, generally calculated as the difference between the estimated fair value and the carrying amount of an asset
or asset group, is recognized if the sum of the estimated undiscounted cash flows relating to the asset or asset group is less than
the corresponding carrying amount. See “Note 8—Goodwill and Intangible Assets” for additional information.
Fair Value
Fair value is defined as the price that would be received for an asset or paid to transfer a liability in an orderly transaction between
market participants on the measurement date (also referred to as an exit price). The fair value accounting guidance provides a