Capital One 2015 Annual Report Download - page 75
Download and view the complete annual report
Please find page 75 of the 2015 Capital One annual report below. You can navigate through the pages in the report by either clicking on the pages listed below, or by using the keyword search tool below to find specific information within the annual report.-
 1
1 -
2
-
3
-
4
-
5
-
6
-
7
-
8
-
9
-
10
-
11
-
12
-
13
-
14
-
15
-
16
-
17
-
18
-
19
-
20
-
21
-
22
-
23
-
24
-
25
-
26
-
27
-
28
-
29
-
30
-
31
-
32
-
33
-
34
-
35
-
36
-
37
-
38
-
39
-
40
-
41
-
42
-
43
-
44
-
45
-
46
-
47
-
48
-
49
-
50
-
51
-
52
-
53
-
54
-
55
-
56
-
57
-
58
-
59
-
60
-
61
-
62
-
63
-
64
-
 65
65 -
 66
66 -
 67
67 -
 68
68 -
 69
69 -
 70
70 -
 71
71 -
 72
72 -
 73
73 -
 74
74 -
 75
75 -
 76
76 -
 77
77 -
 78
78 -
 79
79 -
 80
80 -
 81
81 -
 82
82 -
 83
83 -
 84
84 -
 85
85 -
86
-
87
-
88
-
89
-
90
-
91
-
92
-
93
-
94
-
95
-
96
-
97
-
98
-
99
-
100
-
101
-
102
-
103
-
104
-
105
-
106
-
107
-
108
-
109
-
110
-
111
-
112
-
113
-
114
-
115
-
116
-
117
-
118
-
119
-
120
-
121
-
122
-
123
-
124
-
125
-
126
-
127
-
128
-
129
-
130
-
131
-
132
-
133
-
134
-
135
-
136
-
137
-
138
-
139
-
140
-
141
-
142
-
143
-
144
-
145
-
146
-
147
-
148
-
149
-
150
-
151
-
152
-
153
-
154
-
155
-
156
-
157
-
158
-
159
-
160
-
161
-
162
-
163
-
164
-
165
-
166
-
167
-
168
-
169
-
170
-
171
-
172
-
173
-
174
-
175
-
176
-
177
-
178
-
179
-
180
-
181
-
182
-
183
-
184
-
185
-
186
-
187
-
188
-
189
-
190
-
191
-
192
-
193
-
194
-
195
-
196
-
197
-
198
-
199
-
200
-
201
-
202
-
203
-
204
-
205
-
206
-
207
-
208
-
209
-
210
-
211
-
212
-
213
-
214
-
215
-
216
-
217
-
218
-
219
-
220
-
221
-
222
-
223
-
224
-
225
-
226
-
227
-
228
-
229
-
230
-
231
-
232
-
233
-
234
-
235
-
236
-
237
-
238
-
239
-
240
-
241
-
242
-
243
-
244
-
245
-
246
-
247
-
248
-
249
-
250
-
251
-
252
-
253
 |
 |

56 Capital One Financial Corporation (COF)
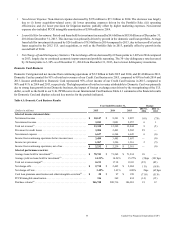
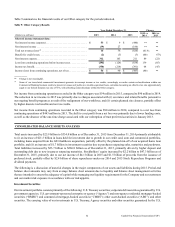
Consumer Banking Business
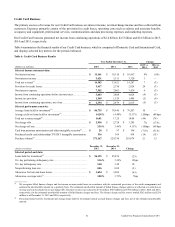
The primary sources of revenue for our Consumer Banking business are net interest income from loans and deposits and non-
interest income from service charges and customer-related fees. Expenses primarily consist of the provision for credit losses,
operating costs, such as salaries and associate benefits, occupancy and equipment costs, professional services, communications
and data processing expenses, as well as marketing expenses.
Our Consumer Banking business generated net income from continuing operations of $1.0 billion, $1.2 billion and $1.5 billion in
2015, 2014 and 2013, respectively.
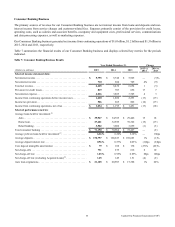
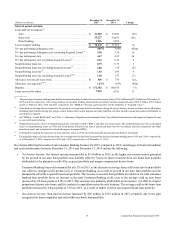
Table 7 summarizes the financial results of our Consumer Banking business and displays selected key metrics for the periods
indicated.
Table 7: Consumer Banking Business Results
Year Ended December 31, Change
(Dollars in millions) 2015 2014 2013 2015 vs.
2014
2014 vs.
2013
Selected income statement data:
Net interest income . . . . . . . . . . . . . . . . . . . . . . . . . . . . . . . . . . . . . . . . $ 5,755 $ 5,748 $ 5,905 — (3)%
Non-interest income . . . . . . . . . . . . . . . . . . . . . . . . . . . . . . . . . . . . . . . 710 684 749 4% (9)
Total net revenue. . . . . . . . . . . . . . . . . . . . . . . . . . . . . . . . . . . . . . . . . . 6,465 6,432 6,654 1 (3)
Provision for credit losses. . . . . . . . . . . . . . . . . . . . . . . . . . . . . . . . . . . 819 703 656 17 7
Non-interest expense. . . . . . . . . . . . . . . . . . . . . . . . . . . . . . . . . . . . . . . 4,026 3,869 3,745 4 3
Income from continuing operations before income taxes. . . . . . . . . . . 1,620 1,860 2,253 (13) (17)
Income tax provision. . . . . . . . . . . . . . . . . . . . . . . . . . . . . . . . . . . . . . . 586 665 802 (12) (17)
Income from continuing operations, net of tax. . . . . . . . . . . . . . . . . . . $ 1,034 $ 1,195 $ 1,451 (13) (18)
Selected performance metrics:
Average loans held for investment:(1)
Auto . . . . . . . . . . . . . . . . . . . . . . . . . . . . . . . . . . . . . . . . . . . . . . . . . $ 39,967 $ 34,769 $ 29,446 15 18
Home loan . . . . . . . . . . . . . . . . . . . . . . . . . . . . . . . . . . . . . . . . . . . . 27,601 32,589 39,322 (15) (17)
Retail banking . . . . . . . . . . . . . . . . . . . . . . . . . . . . . . . . . . . . . . . . . 3,582 3,606 3,699 (1) (3)
Total consumer banking . . . . . . . . . . . . . . . . . . . . . . . . . . . . . . . . . . . . $ 71,150 $ 70,964 $ 72,467 — (2)
Average yield on loans held for investment(2) . . . . . . . . . . . . . . . . . . . . 6.26% 6.26% 6.10% — 16bps
Average deposits. . . . . . . . . . . . . . . . . . . . . . . . . . . . . . . . . . . . . . . . . . $ 170,757 $ 168,623 $ 169,683 1% (1)%
Average deposit interest rate. . . . . . . . . . . . . . . . . . . . . . . . . . . . . . . . . 0.56% 0.57% 0.63% (1)bps (6)bps
Core deposit intangible amortization . . . . . . . . . . . . . . . . . . . . . . . . . . $ 79 $ 108 $ 138 (27)% (22)%
Net charge-offs . . . . . . . . . . . . . . . . . . . . . . . . . . . . . . . . . . . . . . . . . . . 731 675 616 8 10
Net charge-off rate . . . . . . . . . . . . . . . . . . . . . . . . . . . . . . . . . . . . . . . . 1.03% 0.95% 0.85% 8bps 10bps
Net charge-off rate (excluding Acquired Loans)(3) . . . . . . . . . . . . . . . . 1.45 1.49 1.51 (4) (2)
Auto loan originations. . . . . . . . . . . . . . . . . . . . . . . . . . . . . . . . . . . . . . $ 21,185 $ 20,903 $ 17,388 1% 20%