Capital One 2015 Annual Report Download - page 107
Download and view the complete annual report
Please find page 107 of the 2015 Capital One annual report below. You can navigate through the pages in the report by either clicking on the pages listed below, or by using the keyword search tool below to find specific information within the annual report.-
 1
1 -
2
-
3
-
4
-
5
-
6
-
7
-
8
-
9
-
10
-
11
-
12
-
13
-
14
-
15
-
16
-
17
-
18
-
19
-
20
-
21
-
22
-
23
-
24
-
25
-
26
-
27
-
28
-
29
-
30
-
31
-
32
-
33
-
34
-
35
-
36
-
37
-
38
-
39
-
40
-
41
-
42
-
43
-
44
-
45
-
46
-
47
-
48
-
49
-
50
-
51
-
52
-
53
-
54
-
55
-
56
-
57
-
58
-
59
-
60
-
61
-
62
-
63
-
64
-
65
-
66
-
67
-
68
-
69
-
70
-
71
-
72
-
73
-
74
-
75
-
76
-
77
-
78
-
79
-
80
-
81
-
82
-
83
-
84
-
85
-
86
-
87
-
88
-
89
-
90
-
91
-
92
-
93
-
94
-
95
-
96
-
 97
97 -
 98
98 -
 99
99 -
 100
100 -
 101
101 -
 102
102 -
 103
103 -
 104
104 -
 105
105 -
 106
106 -
 107
107 -
 108
108 -
 109
109 -
 110
110 -
 111
111 -
 112
112 -
 113
113 -
 114
114 -
 115
115 -
 116
116 -
 117
117 -
118
-
119
-
120
-
121
-
122
-
123
-
124
-
125
-
126
-
127
-
128
-
129
-
130
-
131
-
132
-
133
-
134
-
135
-
136
-
137
-
138
-
139
-
140
-
141
-
142
-
143
-
144
-
145
-
146
-
147
-
148
-
149
-
150
-
151
-
152
-
153
-
154
-
155
-
156
-
157
-
158
-
159
-
160
-
161
-
162
-
163
-
164
-
165
-
166
-
167
-
168
-
169
-
170
-
171
-
172
-
173
-
174
-
175
-
176
-
177
-
178
-
179
-
180
-
181
-
182
-
183
-
184
-
185
-
186
-
187
-
188
-
189
-
190
-
191
-
192
-
193
-
194
-
195
-
196
-
197
-
198
-
199
-
200
-
201
-
202
-
203
-
204
-
205
-
206
-
207
-
208
-
209
-
210
-
211
-
212
-
213
-
214
-
215
-
216
-
217
-
218
-
219
-
220
-
221
-
222
-
223
-
224
-
225
-
226
-
227
-
228
-
229
-
230
-
231
-
232
-
233
-
234
-
235
-
236
-
237
-
238
-
239
-
240
-
241
-
242
-
243
-
244
-
245
-
246
-
247
-
248
-
249
-
250
-
251
-
252
-
253
 |
 |

88 Capital One Financial Corporation (COF)
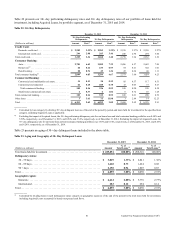
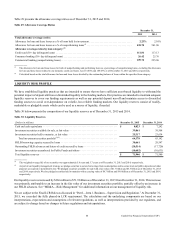
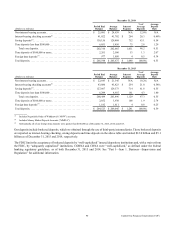
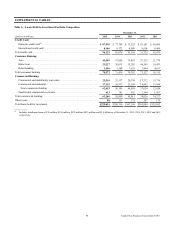
Table 29 presents the allowance coverage ratios as of December 31, 2015 and 2014.
Table 29: Allowance Coverage Ratios
December 31,
2015 2014
Total allowance coverage ratios:
Allowance for loan and lease losses as a % of loans held for investment . . . . . . . . . . . . . . . . . . . . . . . . . . . . . . . . . 2.23% 2.10%
Allowance for loan and lease losses as a % of nonperforming loans(1) . . . . . . . . . . . . . . . . . . . . . . . . . . . . . . . . . . . 438.70 541.86
Allowance coverage ratios by loan category:(2)
Credit card (30+ day delinquent loans) . . . . . . . . . . . . . . . . . . . . . . . . . . . . . . . . . . . . . . . . . . . . . . . . . . . . . . . . . . . 111.81 113.13
Consumer banking (30+ day delinquent loans) . . . . . . . . . . . . . . . . . . . . . . . . . . . . . . . . . . . . . . . . . . . . . . . . . . . . . 26.42 25.76
Commercial banking (nonperforming loans) . . . . . . . . . . . . . . . . . . . . . . . . . . . . . . . . . . . . . . . . . . . . . . . . . . . . . . . 109.76 225.86
__________
(1) The allowance for loan and lease losses for both of nonperforming and performing loans as a percentage of nonperforming loans, excluding the allowance
for loan and lease losses related to our domestic credit card loans, was 151.80% and 186.07% as of December 31, 2015 and 2014, respectively.
(2) Calculated based on the total allowance for loan and lease losses divided by the outstanding balance of loans within the specified loan category.
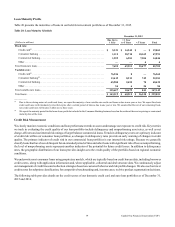
LIQUIDITY RISK PROFILE
We have established liquidity practices that are intended to ensure that we have sufficient asset-based liquidity to withstand the
potential impact of deposit attrition or diminished liquidity in the funding markets. Our practices are intended to maintain adequate
liquidity reserves to cover our funding requirements as well as any potential deposit run-off and maintain access to diversified
funding sources to avoid over-dependence on volatile, less reliable funding markets. Our liquidity reserves consist of readily-
marketable or pledgable assets which can be used as a source of liquidity, if needed.
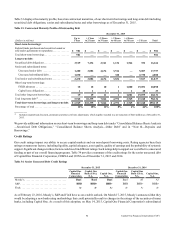
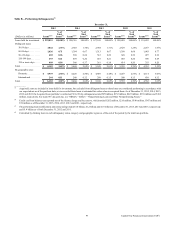
Table 30 below presents the composition of our liquidity reserves as of December 31, 2015 and 2014.
Table 30: Liquidity Reserves
(Dollars in millions) December 31, 2015 December 31, 2014
Cash and cash equivalents . . . . . . . . . . . . . . . . . . . . . . . . . . . . . . . . . . . . . . . . . . . . . . . . . . . . . . . . . . $ 8,023 $ 7,242
Investment securities available for sale, at fair value. . . . . . . . . . . . . . . . . . . . . . . . . . . . . . . . . . . . . . 39,061 39,508
Investment securities held to maturity, at fair value. . . . . . . . . . . . . . . . . . . . . . . . . . . . . . . . . . . . . . . 25,317 23,634
Total investment securities portfolio(1)(2) . . . . . . . . . . . . . . . . . . . . . . . . . . . . . . . . . . . . . . . . . . . . . 64,378 63,142
FHLB borrowing capacity secured by loans . . . . . . . . . . . . . . . . . . . . . . . . . . . . . . . . . . . . . . . . . . . . 30,661 29,547
Outstanding FHLB advances and letters of credit secured by loans . . . . . . . . . . . . . . . . . . . . . . . . . . (20,514) (17,720)
Investment securities encumbered for Public Funds and others. . . . . . . . . . . . . . . . . . . . . . . . . . . . . . (10,602) (10,631)
Total liquidity reserves . . . . . . . . . . . . . . . . . . . . . . . . . . . . . . . . . . . . . . . . . . . . . . . . . . . . . . . . . . . . . $ 71,946 $ 71,580
__________
(1) The weighted-average life of our securities was approximately 5.8 years and 5.7 years as of December 31, 2015 and 2014, respectively.
(2) As part of our liquidity management strategy, we pledge securities to secure borrowings from counterparties and to secure trust and public deposits and other
purposes as required or permitted by law. We pledged securities available for sale with a fair value of $1.7 billion and $3.5 billion as of December 31, 2015
and 2014, respectively. We also pledged securities held to maturity with a carrying value of $8.7 billion and $9.0 billion as of December 31, 2015 and 2014,
respectively.
Our liquidity reserves increased by $366 million to $71.9 billion as of December 31, 2015 from December 31, 2014. This increase
was primarily attributable to an increase in the fair value of our investment securities portfolio, partially offset by an increase in
our FHLB advances. See “MD&A—Risk Management” for additional information on our management of liquidity risk.
We are subject to the Final LCR Rules as discussed in “Part I—Item 1. Business—Supervision and Regulation.” At December 31,
2015, we exceeded the fully phased-in LCR requirement. The calculation and the underlying components are based on our
interpretations, expectations and assumptions of relevant regulations, as well as interpretations provided by our regulators, and
are subject to change based on changes to future regulations and interpretations.