Capital One 2015 Annual Report Download - page 229
Download and view the complete annual report
Please find page 229 of the 2015 Capital One annual report below. You can navigate through the pages in the report by either clicking on the pages listed below, or by using the keyword search tool below to find specific information within the annual report.-
 1
1 -
2
-
3
-
4
-
5
-
6
-
7
-
8
-
9
-
10
-
11
-
12
-
13
-
14
-
15
-
16
-
17
-
18
-
19
-
20
-
21
-
22
-
23
-
24
-
25
-
26
-
27
-
28
-
29
-
30
-
31
-
32
-
33
-
34
-
35
-
36
-
37
-
38
-
39
-
40
-
41
-
42
-
43
-
44
-
45
-
46
-
47
-
48
-
49
-
50
-
51
-
52
-
53
-
54
-
55
-
56
-
57
-
58
-
59
-
60
-
61
-
62
-
63
-
64
-
65
-
66
-
67
-
68
-
69
-
70
-
71
-
72
-
73
-
74
-
75
-
76
-
77
-
78
-
79
-
80
-
81
-
82
-
83
-
84
-
85
-
86
-
87
-
88
-
89
-
90
-
91
-
92
-
93
-
94
-
95
-
96
-
97
-
98
-
99
-
100
-
101
-
102
-
103
-
104
-
105
-
106
-
107
-
108
-
109
-
110
-
111
-
112
-
113
-
114
-
115
-
116
-
117
-
118
-
119
-
120
-
121
-
122
-
123
-
124
-
125
-
126
-
127
-
128
-
129
-
130
-
131
-
132
-
133
-
134
-
135
-
136
-
137
-
138
-
139
-
140
-
141
-
142
-
143
-
144
-
145
-
146
-
147
-
148
-
149
-
150
-
151
-
152
-
153
-
154
-
155
-
156
-
157
-
158
-
159
-
160
-
161
-
162
-
163
-
164
-
165
-
166
-
167
-
168
-
169
-
170
-
171
-
172
-
173
-
174
-
175
-
176
-
177
-
178
-
179
-
180
-
181
-
182
-
183
-
184
-
185
-
186
-
187
-
188
-
189
-
190
-
191
-
192
-
193
-
194
-
195
-
196
-
197
-
198
-
199
-
200
-
201
-
202
-
203
-
204
-
205
-
206
-
207
-
208
-
209
-
210
-
211
-
212
-
213
-
214
-
215
-
216
-
217
-
218
-
 219
219 -
 220
220 -
 221
221 -
 222
222 -
 223
223 -
 224
224 -
 225
225 -
 226
226 -
 227
227 -
 228
228 -
 229
229 -
 230
230 -
 231
231 -
 232
232 -
 233
233 -
 234
234 -
 235
235 -
 236
236 -
 237
237 -
 238
238 -
 239
239 -
240
-
241
-
242
-
243
-
244
-
245
-
246
-
247
-
248
-
249
-
250
-
251
-
252
-
253
 |
 |

CAPITAL ONE FINANCIAL CORPORATION
NOTES TO CONSOLIDATED FINANCIAL STATEMENTS
210 Capital One Financial Corporation (COF)
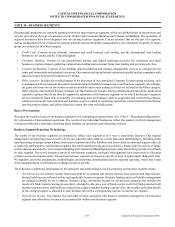
• Provision for credit losses: The provision for credit losses is directly attributable to the business segment in which the loans
are managed.
• Non-interest expense: Non-interest expenses directly managed and incurred by a business segment are accounted for within
each business segment. We allocate certain non-interest expenses indirectly incurred by business segments, such as corporate
support functions, to each business segment based on various factors, including the actual cost of the services from the
service providers, the utilization of the services, the number of employees or other relevant factors.
• Goodwill and intangible assets: Goodwill and intangible assets that are not directly attributable to business segments are
assigned to business segments based on the relative fair value of each segment. Intangible amortization is included in the
results of the applicable segment.
• Income taxes: Income taxes are assessed for each business segment based on a standard tax rate with the residual tax expense
or benefit to arrive at the consolidated effective tax rate included in the Other category.
• Loans held for investment: Loans are reported within each business segment based on product or customer type.
• Deposits: Deposits are reported within each business segment based on product or customer type.
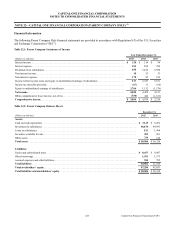
Segment Results and Reconciliation
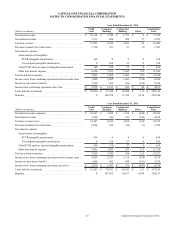
We may periodically change our business segments or reclassify business segment results based on modifications to our management
reporting methodologies and changes in organizational alignment. The following tables present our business segment results for
the years ended December 31, 2015, 2014 and 2013, selected balance sheet data as of 2015, 2014 and 2013, and a reconciliation
of our total business segment results to our reported consolidated income from continuing operations, assets and deposits.
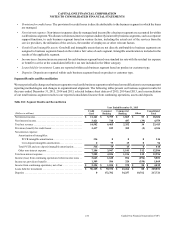
Table 20.1: Segment Results and Reconciliation
Year Ended December 31, 2015
(Dollars in millions)
Credit
Card
Consumer
Banking
Commercial
Banking Other
Consolidated
Total
Net interest income. . . . . . . . . . . . . . . . . . . . . . . . . . . . . . . . . . . . . $ 11,161 $ 5,755 $ 1,865 $ 53 $ 18,834
Non-interest income . . . . . . . . . . . . . . . . . . . . . . . . . . . . . . . . . . . . 3,421 710 487 (39) 4,579
Total net revenue . . . . . . . . . . . . . . . . . . . . . . . . . . . . . . . . . . . . . . 14,582 6,465 2,352 14 23,413
Provision (benefit) for credit losses . . . . . . . . . . . . . . . . . . . . . . . . 3,417 819 302 (2) 4,536
Non-interest expense:
Amortization of intangibles:
PCCR intangible amortization. . . . . . . . . . . . . . . . . . . . . . . 316 0 0 0 316
Core deposit intangible amortization. . . . . . . . . . . . . . . . . . 0 79 15 0 94
Total PCCR and core deposit intangible amortization . . . . . . . 316 79 15 0 410
Other non-interest expense . . . . . . . . . . . . . . . . . . . . . . . . . . . . 7,186 3,947 1,141 312 12,586
Total non-interest expense . . . . . . . . . . . . . . . . . . . . . . . . . . . . . . . 7,502 4,026 1,156 312 12,996
Income (loss) from continuing operations before income taxes . . 3,663 1,620 894 (296) 5,881
Income tax provision (benefit) . . . . . . . . . . . . . . . . . . . . . . . . . . . . 1,309 586 324 (350) 1,869
Income from continuing operations, net of tax . . . . . . . . . . . . . . . $ 2,354 $ 1,034 $ 570 $ 54 $ 4,012
Loans held for investment . . . . . . . . . . . . . . . . . . . . . . . . . . . . . . . $ 96,125 $ 70,372 $ 63,266 $ 88 $ 229,851
Deposits . . . . . . . . . . . . . . . . . . . . . . . . . . . . . . . . . . . . . . . . . . . . . 0 172,702 34,257 10,762 217,721