Capital One 2015 Annual Report Download - page 97
Download and view the complete annual report
Please find page 97 of the 2015 Capital One annual report below. You can navigate through the pages in the report by either clicking on the pages listed below, or by using the keyword search tool below to find specific information within the annual report.-
 1
1 -
2
-
3
-
4
-
5
-
6
-
7
-
8
-
9
-
10
-
11
-
12
-
13
-
14
-
15
-
16
-
17
-
18
-
19
-
20
-
21
-
22
-
23
-
24
-
25
-
26
-
27
-
28
-
29
-
30
-
31
-
32
-
33
-
34
-
35
-
36
-
37
-
38
-
39
-
40
-
41
-
42
-
43
-
44
-
45
-
46
-
47
-
48
-
49
-
50
-
51
-
52
-
53
-
54
-
55
-
56
-
57
-
58
-
59
-
60
-
61
-
62
-
63
-
64
-
65
-
66
-
67
-
68
-
69
-
70
-
71
-
72
-
73
-
74
-
75
-
76
-
77
-
78
-
79
-
80
-
81
-
82
-
83
-
84
-
85
-
86
-
 87
87 -
 88
88 -
 89
89 -
 90
90 -
 91
91 -
 92
92 -
 93
93 -
 94
94 -
 95
95 -
 96
96 -
 97
97 -
 98
98 -
 99
99 -
 100
100 -
 101
101 -
 102
102 -
 103
103 -
 104
104 -
 105
105 -
 106
106 -
 107
107 -
108
-
109
-
110
-
111
-
112
-
113
-
114
-
115
-
116
-
117
-
118
-
119
-
120
-
121
-
122
-
123
-
124
-
125
-
126
-
127
-
128
-
129
-
130
-
131
-
132
-
133
-
134
-
135
-
136
-
137
-
138
-
139
-
140
-
141
-
142
-
143
-
144
-
145
-
146
-
147
-
148
-
149
-
150
-
151
-
152
-
153
-
154
-
155
-
156
-
157
-
158
-
159
-
160
-
161
-
162
-
163
-
164
-
165
-
166
-
167
-
168
-
169
-
170
-
171
-
172
-
173
-
174
-
175
-
176
-
177
-
178
-
179
-
180
-
181
-
182
-
183
-
184
-
185
-
186
-
187
-
188
-
189
-
190
-
191
-
192
-
193
-
194
-
195
-
196
-
197
-
198
-
199
-
200
-
201
-
202
-
203
-
204
-
205
-
206
-
207
-
208
-
209
-
210
-
211
-
212
-
213
-
214
-
215
-
216
-
217
-
218
-
219
-
220
-
221
-
222
-
223
-
224
-
225
-
226
-
227
-
228
-
229
-
230
-
231
-
232
-
233
-
234
-
235
-
236
-
237
-
238
-
239
-
240
-
241
-
242
-
243
-
244
-
245
-
246
-
247
-
248
-
249
-
250
-
251
-
252
-
253
 |
 |

78 Capital One Financial Corporation (COF)
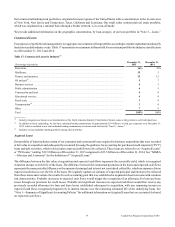
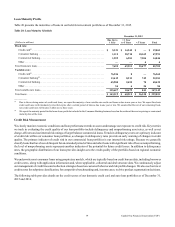
Home Loans
The majority of our home loan portfolio was acquired from the ING Direct and CCB acquisitions. These Acquired Loans represented
73.4% and 77.4% of our total home loan portfolio as of December 31, 2015 and 2014, respectively. See “MD&A—Glossary and
Acronyms” for the definition of ING Direct and CCB acquisitions. The expected cash flows for our Acquired Loans in our home
loan portfolio are significantly impacted by future expectations of home prices and interest rates. Decreases in expected cash flows
that result from declining conditions, particularly associated with these variables, could result in an increase in the allowance for
loan and lease losses and reduction in accretable yield. Charge-offs on these loans are not recorded until the expected credit losses
within the nonaccretable difference are depleted. In addition, Acquired Loans are not classified as delinquent or nonperforming
as we expect to collect our net investment in these loans and the nonaccretable difference is expected to absorb the majority of the
losses associated with these loans.
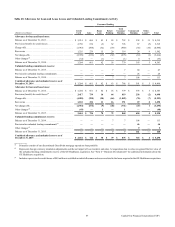
Table 18 presents our total home loan portfolio, and the break out of the acquired home loans and remaining loans within our home
loan portfolio, by lien priority.
Table 18: Home Loans - Risk Profile by Lien Priority
December 31, 2015
Home Loans Acquired Home Loans Total Home Loans
(Dollars in millions) Amount
% of
Total Amount
% of
Total Amount
% of
Total
Lien type:
1st lien. . . . . . . . . . . . . . . . . . . . . . . . . . . . . . . . . . . . . . . . . . . . . . $ 5,705 22.6% $ 18,207 72.2% $ 23,912 94.8%
2nd lien . . . . . . . . . . . . . . . . . . . . . . . . . . . . . . . . . . . . . . . . . . . . . 995 4.0 320 1.2 1,315 5.2
Total . . . . . . . . . . . . . . . . . . . . . . . . . . . . . . . . . . . . . . . . . . . . . . . . . . $ 6,700 26.6% $ 18,527 73.4% $ 25,227 100.0%
December 31, 2014
Home Loans Acquired Home Loans Total Home Loans
(Dollars in millions) Amount
% of
Total Amount
% of
Total Amount
% of
Total
Lien type:
1st lien. . . . . . . . . . . . . . . . . . . . . . . . . . . . . . . . . . . . . . . . . . . . . . $ 5,756 19.2% $ 22,883 76.2% $ 28,639 95.4%
2nd lien . . . . . . . . . . . . . . . . . . . . . . . . . . . . . . . . . . . . . . . . . . . . . 1,038 3.4 358 1.2 1,396 4.6
Total . . . . . . . . . . . . . . . . . . . . . . . . . . . . . . . . . . . . . . . . . . . . . . . . . . $ 6,794 22.6% $ 23,241 77.4% $ 30,035 100.0%
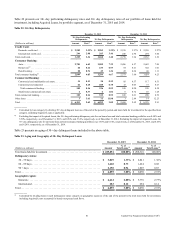
See “Note 5—Loans” in this Report for additional credit quality information. See “Note 1—Summary of Significant Accounting
Policies” for information on our accounting policies for Acquired Loans, delinquent loans, nonperforming loans, net charge-offs
and troubled debt restructurings (“TDRs”) for each of our loan categories.
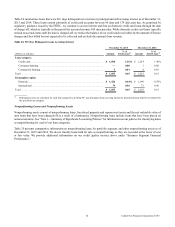
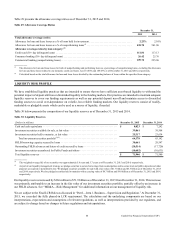
Table 19 provides a sensitivity analysis of Acquired Loans in our home loan portfolio as of December 31, 2015. The analysis
reflects a hypothetical decline of 10% in the home price index and its impact on lifetime future cash flow expectations, accretable
yield and allowance for loan and lease losses. Any significant economic events or variables not considered could impact results
that are presented below.
Table 19: Sensitivity Analysis - Acquired Home Loans(1)
(Dollars in millions)
December 31,
2015
Estimated Impact
Increase (Decrease)
Expected cash flows . . . . . . . . . . . . . . . . . . . . . . . . . . . . . . . . . . . . . . . . . . . . . . . . . . . . . . . . . . . . . . . . . . $ 21,795 $ (88)
Accretable yield . . . . . . . . . . . . . . . . . . . . . . . . . . . . . . . . . . . . . . . . . . . . . . . . . . . . . . . . . . . . . . . . . . . . . 3,304 63
Allowance for loan and lease losses . . . . . . . . . . . . . . . . . . . . . . . . . . . . . . . . . . . . . . . . . . . . . . . . . . . . . . 36 151
__________
(1) Changes in the accretable yield would be recognized in interest income in our consolidated statements of income over the life of the loans. Changes in the
allowance for loan and lease losses would be recognized immediately in the provision for credit losses in the consolidated statements of income.