Capital One 2015 Annual Report Download - page 206
Download and view the complete annual report
Please find page 206 of the 2015 Capital One annual report below. You can navigate through the pages in the report by either clicking on the pages listed below, or by using the keyword search tool below to find specific information within the annual report.-
 1
1 -
2
-
3
-
4
-
5
-
6
-
7
-
8
-
9
-
10
-
11
-
12
-
13
-
14
-
15
-
16
-
17
-
18
-
19
-
20
-
21
-
22
-
23
-
24
-
25
-
26
-
27
-
28
-
29
-
30
-
31
-
32
-
33
-
34
-
35
-
36
-
37
-
38
-
39
-
40
-
41
-
42
-
43
-
44
-
45
-
46
-
47
-
48
-
49
-
50
-
51
-
52
-
53
-
54
-
55
-
56
-
57
-
58
-
59
-
60
-
61
-
62
-
63
-
64
-
65
-
66
-
67
-
68
-
69
-
70
-
71
-
72
-
73
-
74
-
75
-
76
-
77
-
78
-
79
-
80
-
81
-
82
-
83
-
84
-
85
-
86
-
87
-
88
-
89
-
90
-
91
-
92
-
93
-
94
-
95
-
96
-
97
-
98
-
99
-
100
-
101
-
102
-
103
-
104
-
105
-
106
-
107
-
108
-
109
-
110
-
111
-
112
-
113
-
114
-
115
-
116
-
117
-
118
-
119
-
120
-
121
-
122
-
123
-
124
-
125
-
126
-
127
-
128
-
129
-
130
-
131
-
132
-
133
-
134
-
135
-
136
-
137
-
138
-
139
-
140
-
141
-
142
-
143
-
144
-
145
-
146
-
147
-
148
-
149
-
150
-
151
-
152
-
153
-
154
-
155
-
156
-
157
-
158
-
159
-
160
-
161
-
162
-
163
-
164
-
165
-
166
-
167
-
168
-
169
-
170
-
171
-
172
-
173
-
174
-
175
-
176
-
177
-
178
-
179
-
180
-
181
-
182
-
183
-
184
-
185
-
186
-
187
-
188
-
189
-
190
-
191
-
192
-
193
-
194
-
195
-
 196
196 -
 197
197 -
 198
198 -
 199
199 -
 200
200 -
 201
201 -
 202
202 -
 203
203 -
 204
204 -
 205
205 -
 206
206 -
 207
207 -
 208
208 -
 209
209 -
 210
210 -
 211
211 -
 212
212 -
 213
213 -
 214
214 -
 215
215 -
 216
216 -
217
-
218
-
219
-
220
-
221
-
222
-
223
-
224
-
225
-
226
-
227
-
228
-
229
-
230
-
231
-
232
-
233
-
234
-
235
-
236
-
237
-
238
-
239
-
240
-
241
-
242
-
243
-
244
-
245
-
246
-
247
-
248
-
249
-
250
-
251
-
252
-
253
 |
 |

CAPITAL ONE FINANCIAL CORPORATION
NOTES TO CONSOLIDATED FINANCIAL STATEMENTS
187 Capital One Financial Corporation (COF)
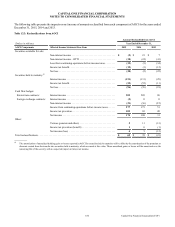
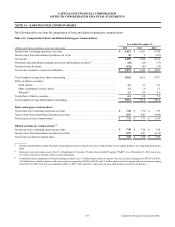
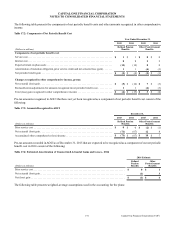
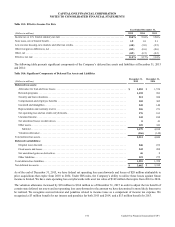
Table 16.2: Stock Options Cash Flow Impact
Year ended December 31,
(Dollars in millions) 2015 2014 2013
Cash received for options exercised . . . . . . . . . . . . . . . . . . . . . . . . . . . . . . . . . . . . . . . . . . . . . . . . . . . . . . $ 64 $ 131 $ 105
Tax benefit realized for options exercised. . . . . . . . . . . . . . . . . . . . . . . . . . . . . . . . . . . . . . . . . . . . . . . . . . 99 18
Compensation expense for stock options is based on the grant date fair value, which is estimated using the Black-Scholes option-
pricing model. Certain stock options have discretionary vesting conditions and are remeasured at fair value each reporting period.
The option pricing model requires the use of numerous assumptions, many of which are subjective.
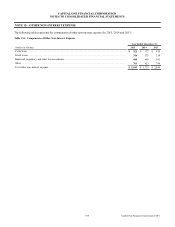
The following table presents the weighted-average assumptions used to value stock options granted during 2015, 2014 and 2013.
Table 16.3: Fair Value of Stock Options Granted
Year Ended December 31,
2015 2014 2013
Dividend yield(1) . . . . . . . . . . . . . . . . . . . . . . . . . . . . . . . . . . . . . . . . . . . . . . . . . . . . . . . . . . . . . . . . . . . . . 1.82% 1.74% 2.29%
Volatility(2) . . . . . . . . . . . . . . . . . . . . . . . . . . . . . . . . . . . . . . . . . . . . . . . . . . . . . . . . . . . . . . . . . . . . . . . . . . 24.00 26.00 32.00
Risk-free interest rate(3) . . . . . . . . . . . . . . . . . . . . . . . . . . . . . . . . . . . . . . . . . . . . . . . . . . . . . . . . . . . . . . . . 1.55 1.92 1.07
Expected option lives(4) . . . . . . . . . . . . . . . . . . . . . . . . . . . . . . . . . . . . . . . . . . . . . . . . . . . . . . . . . . . . . . . . 6.3 years 6.1 years 5.6 years
__________
(1) Represents the expected dividend rate over the life of the option.
(2) Based on the implied volatility of exchange-traded options and warrants.
(3) Based on the U.S. Treasury yield curve.
(4) Represents the period of time that options granted are expected to remain outstanding based on historical activities.
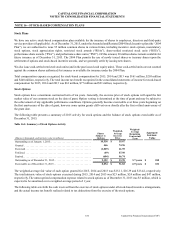
Restricted Stock Awards and Units
RSAs and RSUs represent share-settled awards that do not contain performance conditions and are granted to certain employees
at no cost to the recipient. RSAs and RSUs generally vest over three years from the date of grant, however some RSAs and RSUs
cliff vest on or shortly after the first or third anniversary of the grant date. These awards and units are subject to forfeiture until
certain restrictions have lapsed, including continued employment for a specified period of time. A recipient of a RSA is entitled
to voting rights and is generally entitled to dividends on the common stock. A recipient of a RSU is entitled to receive a share of
common stock after the applicable restrictions lapse. Additionally, a recipient of a RSU is generally entitled to receive cash payments
or additional shares of common stock equivalent to any dividends paid on the underlying common stock during the period the
RSU is outstanding, but is not entitled to voting rights.
Generally, the value of RSAs and RSUs will equal the fair market value of our common stock on the date of grant and the expense
is recognized over the vesting period.