Capital One 2015 Annual Report Download - page 71
Download and view the complete annual report
Please find page 71 of the 2015 Capital One annual report below. You can navigate through the pages in the report by either clicking on the pages listed below, or by using the keyword search tool below to find specific information within the annual report.-
 1
1 -
2
-
3
-
4
-
5
-
6
-
7
-
8
-
9
-
10
-
11
-
12
-
13
-
14
-
15
-
16
-
17
-
18
-
19
-
20
-
21
-
22
-
23
-
24
-
25
-
26
-
27
-
28
-
29
-
30
-
31
-
32
-
33
-
34
-
35
-
36
-
37
-
38
-
39
-
40
-
41
-
42
-
43
-
44
-
45
-
46
-
47
-
48
-
49
-
50
-
51
-
52
-
53
-
54
-
55
-
56
-
57
-
58
-
59
-
60
-
 61
61 -
 62
62 -
 63
63 -
 64
64 -
 65
65 -
 66
66 -
 67
67 -
 68
68 -
 69
69 -
 70
70 -
 71
71 -
 72
72 -
 73
73 -
 74
74 -
 75
75 -
 76
76 -
 77
77 -
 78
78 -
 79
79 -
 80
80 -
 81
81 -
82
-
83
-
84
-
85
-
86
-
87
-
88
-
89
-
90
-
91
-
92
-
93
-
94
-
95
-
96
-
97
-
98
-
99
-
100
-
101
-
102
-
103
-
104
-
105
-
106
-
107
-
108
-
109
-
110
-
111
-
112
-
113
-
114
-
115
-
116
-
117
-
118
-
119
-
120
-
121
-
122
-
123
-
124
-
125
-
126
-
127
-
128
-
129
-
130
-
131
-
132
-
133
-
134
-
135
-
136
-
137
-
138
-
139
-
140
-
141
-
142
-
143
-
144
-
145
-
146
-
147
-
148
-
149
-
150
-
151
-
152
-
153
-
154
-
155
-
156
-
157
-
158
-
159
-
160
-
161
-
162
-
163
-
164
-
165
-
166
-
167
-
168
-
169
-
170
-
171
-
172
-
173
-
174
-
175
-
176
-
177
-
178
-
179
-
180
-
181
-
182
-
183
-
184
-
185
-
186
-
187
-
188
-
189
-
190
-
191
-
192
-
193
-
194
-
195
-
196
-
197
-
198
-
199
-
200
-
201
-
202
-
203
-
204
-
205
-
206
-
207
-
208
-
209
-
210
-
211
-
212
-
213
-
214
-
215
-
216
-
217
-
218
-
219
-
220
-
221
-
222
-
223
-
224
-
225
-
226
-
227
-
228
-
229
-
230
-
231
-
232
-
233
-
234
-
235
-
236
-
237
-
238
-
239
-
240
-
241
-
242
-
243
-
244
-
245
-
246
-
247
-
248
-
249
-
250
-
251
-
252
-
253
 |
 |
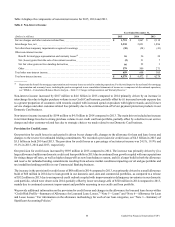
52 Capital One Financial Corporation (COF)
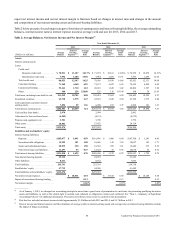
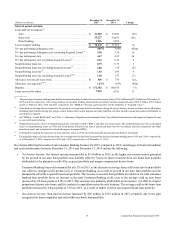
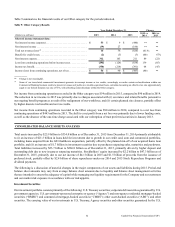
(3) Calculated by dividing interest income for the period by average loans held for investment during the period. Interest income excludes various allocations
including funds transfer pricing that assigns certain balance sheet assets, deposits and other liabilities and their related revenue and expenses attributable to
each business segment. The transfer of the Best Buy Stores, L.P. (“Best Buy”) loan portfolio to held for sale resulted in an increase in the average yield for
the total Credit Card business of 90 basis points in 2013.
(4) Calculated by dividing total net revenue for the period by average loans held for investment during the period for the specified loan category. Interest income
also includes interest income on loans held for sale. The transfer of the Best Buy loan portfolio from loans held for investment to loans held for sale resulted
in an increase in the net revenue margin for the total Credit Card business of 100 basis points in 2013.
(5) Represents the net reduction in interest income attributable to the amortization of premiums on purchased loans accounted for based on contractual cash
flows and the accretion of other intangibles associated with the 2012 U.S. card acquisition.
(6) Consists of credit card purchase transactions, net of returns for the period for both loans classified as held for investment and loans classified as held for
sale. Excludes cash advance and balance transfer transactions.
(7) Calculated by dividing the allowance for loan and lease losses as of the end of the period by period-end loans held for investment.
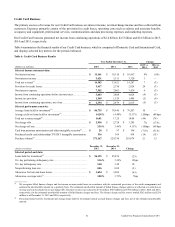
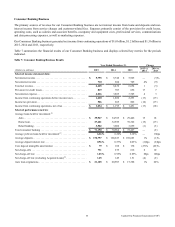
Key factors affecting the results of our Credit Card business for 2015, compared to 2014, and changes in financial condition and
credit performance between December 31, 2015 and December 31, 2014 include the following:
• Net Interest Income: Net interest income increased by $851 million to $11.2 billion in 2015, primarily driven by loan growth
in our Domestic Card business.
• Non-Interest Income: Non-interest income increased by $110 million to $3.4 billion in 2015. The increase was primarily
attributable to an increase in interchange fees driven by higher purchase volume, partially offset by (i) increased rewards
expense due to a greater proportion of customers with rewards coupled with increased spend on products with higher rewards;
and (ii) lower service charges and other customer-related fees primarily due to the continued run-off of our payment protection
products in our Domestic Card business.
• Provision for Credit Losses: The provision for credit losses increased by $667 million to $3.4 billion in 2015, primarily
driven by a larger allowance build in our domestic credit card loan portfolio in 2015 due to continued loan growth coupled
with our expectations for rising charge-off rates, as well as higher charge-offs as new loan balances season.
• Non-Interest Expense: Non-interest expense increased by $439 million to $7.5 billion in 2015. The increase was due to
higher operating and marketing expenses associated with loan growth, partially offset by operating efficiencies and lower
intangibles amortization expense.
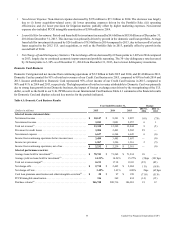
• Loans Held for Investment: Period-end loans held for investment increased by $10.2 billion to $96.1 billion as of
December 31, 2015 from December 31, 2014, and average loans held for investment increased by $7.8 billion to $86.7
billion in 2015 compared to 2014. The increases were primarily due to loan growth in our domestic card loan portfolio,
partially offset by the impact of foreign exchange rates in our international card loan portfolio driven by the strengthening
of the U.S. dollar in 2015.
• Net Charge-off and Delinquency Statistics: The net charge-off rate decreased by 10 basis points to 3.36% in 2015 compared
to 2014, driven by our international card loan portfolio which benefited from the ramp up of our international partnership
portfolio in Canada. The 30+ day delinquency rate increased by 10 basis points to 3.40% as of December 31, 2015 from
December 31, 2014 due to the seasoning of our domestic card portfolio growth which has begun to put upward pressure on
delinquencies.
Key factors affecting the results of our Credit Card business for 2014, compared to 2013, and changes in financial condition and
credit performance between December 31, 2014 and December 31, 2013 include the following:
• Net Interest Income: Net interest income decreased by $657 million to $10.3 billion in 2014. The decrease in net interest
income was primarily driven by the Portfolio Sale in the third quarter of 2013.
• Non-Interest Income: Non-interest income was consistent at $3.3 billion in 2014 compared to 2013. During 2014 there was
an increase in net interchange fees driven by higher purchase volume, offset by a reduction in service charges and other
customer-related fees due to strategic choices we made in our Domestic Card business.
• Provision for Credit Losses: The provision for credit losses decreased by $74 million to $2.8 billion in 2014. The decrease
was due to lower net charge-offs, partially offset by an absence of a release in the allowance for loan and lease losses that
was incurred in 2013 related to the domestic card loan portfolio.