Capital One 2015 Annual Report Download - page 57
Download and view the complete annual report
Please find page 57 of the 2015 Capital One annual report below. You can navigate through the pages in the report by either clicking on the pages listed below, or by using the keyword search tool below to find specific information within the annual report.-
 1
1 -
2
-
3
-
4
-
5
-
6
-
7
-
8
-
9
-
10
-
11
-
12
-
13
-
14
-
15
-
16
-
17
-
18
-
19
-
20
-
21
-
22
-
23
-
24
-
25
-
26
-
27
-
28
-
29
-
30
-
31
-
32
-
33
-
34
-
35
-
36
-
37
-
38
-
39
-
40
-
41
-
42
-
43
-
44
-
45
-
46
-
 47
47 -
 48
48 -
 49
49 -
 50
50 -
 51
51 -
 52
52 -
 53
53 -
 54
54 -
 55
55 -
 56
56 -
 57
57 -
 58
58 -
 59
59 -
 60
60 -
 61
61 -
 62
62 -
 63
63 -
 64
64 -
 65
65 -
 66
66 -
 67
67 -
68
-
69
-
70
-
71
-
72
-
73
-
74
-
75
-
76
-
77
-
78
-
79
-
80
-
81
-
82
-
83
-
84
-
85
-
86
-
87
-
88
-
89
-
90
-
91
-
92
-
93
-
94
-
95
-
96
-
97
-
98
-
99
-
100
-
101
-
102
-
103
-
104
-
105
-
106
-
107
-
108
-
109
-
110
-
111
-
112
-
113
-
114
-
115
-
116
-
117
-
118
-
119
-
120
-
121
-
122
-
123
-
124
-
125
-
126
-
127
-
128
-
129
-
130
-
131
-
132
-
133
-
134
-
135
-
136
-
137
-
138
-
139
-
140
-
141
-
142
-
143
-
144
-
145
-
146
-
147
-
148
-
149
-
150
-
151
-
152
-
153
-
154
-
155
-
156
-
157
-
158
-
159
-
160
-
161
-
162
-
163
-
164
-
165
-
166
-
167
-
168
-
169
-
170
-
171
-
172
-
173
-
174
-
175
-
176
-
177
-
178
-
179
-
180
-
181
-
182
-
183
-
184
-
185
-
186
-
187
-
188
-
189
-
190
-
191
-
192
-
193
-
194
-
195
-
196
-
197
-
198
-
199
-
200
-
201
-
202
-
203
-
204
-
205
-
206
-
207
-
208
-
209
-
210
-
211
-
212
-
213
-
214
-
215
-
216
-
217
-
218
-
219
-
220
-
221
-
222
-
223
-
224
-
225
-
226
-
227
-
228
-
229
-
230
-
231
-
232
-
233
-
234
-
235
-
236
-
237
-
238
-
239
-
240
-
241
-
242
-
243
-
244
-
245
-
246
-
247
-
248
-
249
-
250
-
251
-
252
-
253
 |
 |

38 Capital One Financial Corporation (COF)
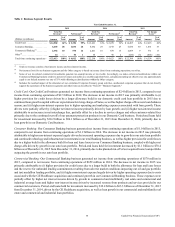
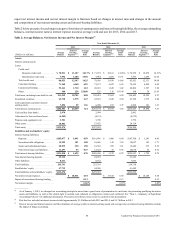
Table 1: Business Segment Results
Year Ended December 31,
2015 2014 2013
Total Net
Revenue(1) Net Income(2) Total Net
Revenue(1) Net Income(2) Total Net
Revenue(1) Net Income
(Loss)(2)
(Dollars in millions) Amount
% of
Total Amount
% of
Total Amount
% of
Total Amount
% of
Total Amount
% of
Total Amount
% of
Total
Credit Card . . . . . . . . . . . . . . . . . . $ 14,582 62% $ 2,354 59% $ 13,621 61% $ 2,479 56% $ 14,287 64% $ 2,615 60%
Consumer Banking . . . . . . . . . . . . 6,465 28 1,034 26 6,432 29 1,195 27 6,654 30 1,451 33
Commercial Banking(3) . . . . . . . . . 2,352 10 570 14 2,201 10 659 15 2,069 9 731 17
Other(4) . . . . . . . . . . . . . . . . . . . . . . 14 — 54 1 36 — 90 2 (626) (3) (443) (10)
Total from continuing operations .$ 23,413 100% $ 4,012 100% $ 22,290 100% $ 4,423 100% $ 22,384 100% $ 4,354 100%
__________
(1) Total net revenue consists of net interest income and non-interest income.
(2) Net income (loss) for our business segments and the Other category is based on income (loss) from continuing operations, net of tax.
(3) Some of our tax-related commercial investments generate tax-exempt income or tax credits. Accordingly, we make certain reclassifications within our
Commercial Banking business results to present revenues and yields on a taxable-equivalent basis, calculated assuming an effective tax rate approximately
equal to our federal statutory tax rate of 35% with offsetting reclassifications within the Other category.
(4) Includes the residual impact of the allocation of our centralized Corporate Treasury group activities, unallocated corporate expenses that do not directly
support the operations of the business segments and other items as described in “Note 20—Business Segments.”
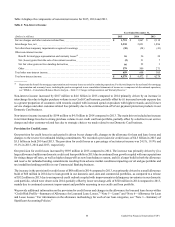
Credit Card: Our Credit Card business generated net income from continuing operations of $2.4 billion in 2015, compared to net
income from continuing operations of $2.5 billion in 2014. The decrease in net income in 2015 was primarily attributable to (i)
higher provision for credit losses driven by a larger allowance build in our domestic credit card loan portfolio in 2015 due to
continued loan growth coupled with our expectations for rising charge-off rates, as well as higher charge-offs as new loan balances
season; and (ii) higher non-interest expense due to higher operating and marketing expenses associated with loan growth. These
drivers were partially offset by (i) higher net interest income primarily driven by loan growth; and (ii) higher non-interest income
attributable to an increase in net interchange fees, partially offset by a decline in service charges and other customer-related fees
primarily due to the continued run-off of our payment protection products in our Domestic Card business. Period-end loans held
for investment increased by $10.2 billion to $96.1 billion as of December 31, 2015 from December 31, 2014, primarily due to
loan growth in our Domestic Card business.
Consumer Banking: Our Consumer Banking business generated net income from continuing operations of $1.0 billion in 2015,
compared to net income from continuing operations of $1.2 billion in 2014. The decrease in net income in 2015 was primarily
attributable to higher non-interest expense largely driven by increased operating expenses due to growth in our auto loan portfolio
and continued technology and infrastructure investments in our retail banking business, as well as higher provision for credit losses
due to a higher build in the allowance build for loan and lease losses in our Consumer Banking business, coupled with higher net
charge-offs driven by growth in our auto loan portfolio. Period-end loans held for investment decreased by $1.1 billion to $70.4
billion as of December 31, 2015 from December 31, 2014, primarily due to the planned run-off of our acquired home loan portfolio
outpacing the growth in our auto loan portfolio.
Commercial Banking: Our Commercial Banking business generated net income from continuing operations of $570 million in
2015, compared to net income from continuing operations of $659 million in 2014. The decrease in net income in 2015 was
primarily attributable to (i) higher provision for credit losses due to a larger build in both the allowance for loan and lease losses
and the reserve for unfunded lending commitments resulting from adverse market conditions impacting our oil and gas portfolio
and taxi medallion lending portfolio, and (ii) higher non-interest expense largely driven by higher operating expenses due to costs
associated with the GE Healthcare acquisition and continued growth in our Commercial Banking business. These expenses were
partially offset by higher net interest income driven by growth in commercial and multifamily real estate and commercial and
industrial average loans and higher non-interest income driven by increased revenue from products and services provided to our
commercial customers. Period-end loans held for investment increased by $12.4 billion to $63.3 billion as of December 31, 2015
from December 31, 2014, driven by the GE Healthcare acquisition, as well as loan growth in our commercial and multifamily real
estate and commercial and industrial loan portfolios.