Capital One 2015 Annual Report Download - page 103
Download and view the complete annual report
Please find page 103 of the 2015 Capital One annual report below. You can navigate through the pages in the report by either clicking on the pages listed below, or by using the keyword search tool below to find specific information within the annual report.-
 1
1 -
2
-
3
-
4
-
5
-
6
-
7
-
8
-
9
-
10
-
11
-
12
-
13
-
14
-
15
-
16
-
17
-
18
-
19
-
20
-
21
-
22
-
23
-
24
-
25
-
26
-
27
-
28
-
29
-
30
-
31
-
32
-
33
-
34
-
35
-
36
-
37
-
38
-
39
-
40
-
41
-
42
-
43
-
44
-
45
-
46
-
47
-
48
-
49
-
50
-
51
-
52
-
53
-
54
-
55
-
56
-
57
-
58
-
59
-
60
-
61
-
62
-
63
-
64
-
65
-
66
-
67
-
68
-
69
-
70
-
71
-
72
-
73
-
74
-
75
-
76
-
77
-
78
-
79
-
80
-
81
-
82
-
83
-
84
-
85
-
86
-
87
-
88
-
89
-
90
-
91
-
92
-
 93
93 -
 94
94 -
 95
95 -
 96
96 -
 97
97 -
 98
98 -
 99
99 -
 100
100 -
 101
101 -
 102
102 -
 103
103 -
 104
104 -
 105
105 -
 106
106 -
 107
107 -
 108
108 -
 109
109 -
 110
110 -
 111
111 -
 112
112 -
 113
113 -
114
-
115
-
116
-
117
-
118
-
119
-
120
-
121
-
122
-
123
-
124
-
125
-
126
-
127
-
128
-
129
-
130
-
131
-
132
-
133
-
134
-
135
-
136
-
137
-
138
-
139
-
140
-
141
-
142
-
143
-
144
-
145
-
146
-
147
-
148
-
149
-
150
-
151
-
152
-
153
-
154
-
155
-
156
-
157
-
158
-
159
-
160
-
161
-
162
-
163
-
164
-
165
-
166
-
167
-
168
-
169
-
170
-
171
-
172
-
173
-
174
-
175
-
176
-
177
-
178
-
179
-
180
-
181
-
182
-
183
-
184
-
185
-
186
-
187
-
188
-
189
-
190
-
191
-
192
-
193
-
194
-
195
-
196
-
197
-
198
-
199
-
200
-
201
-
202
-
203
-
204
-
205
-
206
-
207
-
208
-
209
-
210
-
211
-
212
-
213
-
214
-
215
-
216
-
217
-
218
-
219
-
220
-
221
-
222
-
223
-
224
-
225
-
226
-
227
-
228
-
229
-
230
-
231
-
232
-
233
-
234
-
235
-
236
-
237
-
238
-
239
-
240
-
241
-
242
-
243
-
244
-
245
-
246
-
247
-
248
-
249
-
250
-
251
-
252
-
253
 |
 |

84 Capital One Financial Corporation (COF)
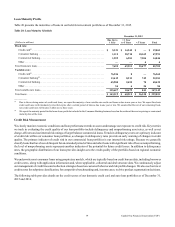
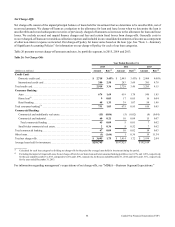
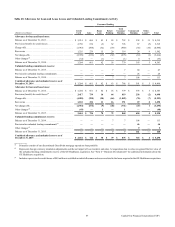
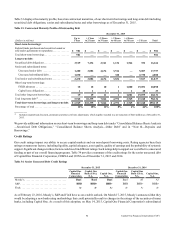
Net Charge-Offs
Net charge-offs consist of the unpaid principal balance of loans held for investment that we determine to be uncollectible, net of
recovered amounts. We charge-off loans as a reduction to the allowance for loan and lease losses when we determine the loan is
uncollectible and record subsequent recoveries of previously charged off amounts as increases to the allowance for loan and lease
losses. We exclude accrued and unpaid finance charges and fees and certain fraud losses from charge-offs. Generally costs to
recover charged-off loans are recorded as collection expenses and included in our consolidated statements of income as a component
of other non-interest expense as incurred. Our charge-off policy for loans varies based on the loan type. See “Note 1—Summary
of Significant Accounting Policies” for information on our charge-off policy for each of our loan categories.
Table 26 presents our net charge-off amounts and rates, by portfolio segment, in 2015, 2014 and 2013.
Table 26: Net Charge-Offs
Year Ended December 31,
2015 2014 2013
(Dollars in millions) Amount Rate(1) Amount Rate(1) Amount Rate(1)
Credit Card:
Domestic credit card. . . . . . . . . . . . . . . . . . . . . . . . . . . . . . . . . . . . . . . $ 2,718 3.45% $ 2,445 3.43% $ 2,904 4.08%
International credit card . . . . . . . . . . . . . . . . . . . . . . . . . . . . . . . . . . . . 200 2.50 283 3.69 381 4.78
Total credit card . . . . . . . . . . . . . . . . . . . . . . . . . . . . . . . . . . . . . . . . . . . . . 2,918 3.36 2,728 3.46 3,285 4.15
Consumer Banking:
Auto . . . . . . . . . . . . . . . . . . . . . . . . . . . . . . . . . . . . . . . . . . . . . . . . . . . 674 1.69 619 1.78 546 1.85
Home loan(2) . . . . . . . . . . . . . . . . . . . . . . . . . . . . . . . . . . . . . . . . . . . . . 9 0.03 17 0.05 16 0.04
Retail banking. . . . . . . . . . . . . . . . . . . . . . . . . . . . . . . . . . . . . . . . . . . . 48 1.33 39 1.07 54 1.46
Total consumer banking(2) . . . . . . . . . . . . . . . . . . . . . . . . . . . . . . . . . . . . . 731 1.03 675 0.95 616 0.85
Commercial Banking:
Commercial and multifamily real estate. . . . . . . . . . . . . . . . . . . . . . . . (15) (0.06) (5) (0.02) (8) (0.04)
Commercial and industrial . . . . . . . . . . . . . . . . . . . . . . . . . . . . . . . . . . 60 0.21 10 0.04 15 0.07
Total commercial lending . . . . . . . . . . . . . . . . . . . . . . . . . . . . . . . . . 45 0.09 5 0.01 7 0.02
Small-ticket commercial real estate . . . . . . . . . . . . . . . . . . . . . . . . . . . 2 0.36 5 0.52 7 0.62
Total commercial banking . . . . . . . . . . . . . . . . . . . . . . . . . . . . . . . . . . . . . 47 0.09 10 0.02 14 0.03
Other loans. . . . . . . . . . . . . . . . . . . . . . . . . . . . . . . . . . . . . . . . . . . . . . . . . (1) (1.66) 1 0.36 19 11.34
Total net charge-offs . . . . . . . . . . . . . . . . . . . . . . . . . . . . . . . . . . . . . . . . . $ 3,695 1.75 $ 3,414 1.72 $ 3,934 2.04
Average loans held for investment. . . . . . . . . . . . . . . . . . . . . . . . . . . . . . . $210,745 $ 197,925 $ 192,614
__________
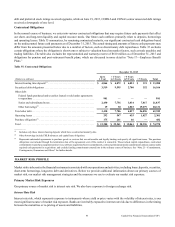
(1) Calculated for each loan category by dividing net charge-offs for the period by average loans held for investment during the period.
(2) Excluding the impact of Acquired Loans, the net charge-off rate for our home loan and total consumer banking portfolios was 0.13% and 1.45%, respectively,
for the year ended December 31, 2015, compared to 0.24% and 1.49%, respectively, for the year ended December 31, 2014; and 0.21% and 1.51% , respectively,
for the year ended December 31, 2013.
For information regarding management’s expectations of net charge-offs, see “MD&A—Business Segment Expectations.”