Capital One 2015 Annual Report Download - page 96
Download and view the complete annual report
Please find page 96 of the 2015 Capital One annual report below. You can navigate through the pages in the report by either clicking on the pages listed below, or by using the keyword search tool below to find specific information within the annual report.-
 1
1 -
2
-
3
-
4
-
5
-
6
-
7
-
8
-
9
-
10
-
11
-
12
-
13
-
14
-
15
-
16
-
17
-
18
-
19
-
20
-
21
-
22
-
23
-
24
-
25
-
26
-
27
-
28
-
29
-
30
-
31
-
32
-
33
-
34
-
35
-
36
-
37
-
38
-
39
-
40
-
41
-
42
-
43
-
44
-
45
-
46
-
47
-
48
-
49
-
50
-
51
-
52
-
53
-
54
-
55
-
56
-
57
-
58
-
59
-
60
-
61
-
62
-
63
-
64
-
65
-
66
-
67
-
68
-
69
-
70
-
71
-
72
-
73
-
74
-
75
-
76
-
77
-
78
-
79
-
80
-
81
-
82
-
83
-
84
-
85
-
 86
86 -
 87
87 -
 88
88 -
 89
89 -
 90
90 -
 91
91 -
 92
92 -
 93
93 -
 94
94 -
 95
95 -
 96
96 -
 97
97 -
 98
98 -
 99
99 -
 100
100 -
 101
101 -
 102
102 -
 103
103 -
 104
104 -
 105
105 -
 106
106 -
107
-
108
-
109
-
110
-
111
-
112
-
113
-
114
-
115
-
116
-
117
-
118
-
119
-
120
-
121
-
122
-
123
-
124
-
125
-
126
-
127
-
128
-
129
-
130
-
131
-
132
-
133
-
134
-
135
-
136
-
137
-
138
-
139
-
140
-
141
-
142
-
143
-
144
-
145
-
146
-
147
-
148
-
149
-
150
-
151
-
152
-
153
-
154
-
155
-
156
-
157
-
158
-
159
-
160
-
161
-
162
-
163
-
164
-
165
-
166
-
167
-
168
-
169
-
170
-
171
-
172
-
173
-
174
-
175
-
176
-
177
-
178
-
179
-
180
-
181
-
182
-
183
-
184
-
185
-
186
-
187
-
188
-
189
-
190
-
191
-
192
-
193
-
194
-
195
-
196
-
197
-
198
-
199
-
200
-
201
-
202
-
203
-
204
-
205
-
206
-
207
-
208
-
209
-
210
-
211
-
212
-
213
-
214
-
215
-
216
-
217
-
218
-
219
-
220
-
221
-
222
-
223
-
224
-
225
-
226
-
227
-
228
-
229
-
230
-
231
-
232
-
233
-
234
-
235
-
236
-
237
-
238
-
239
-
240
-
241
-
242
-
243
-
244
-
245
-
246
-
247
-
248
-
249
-
250
-
251
-
252
-
253
 |
 |

77 Capital One Financial Corporation (COF)
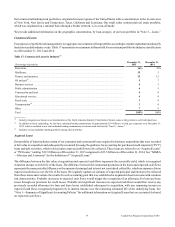
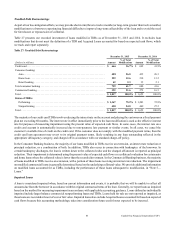
Our commercial banking loan portfolio is originated in most regions of the United States with a concentration in the tri-state area
of New York, New Jersey and Connecticut, Texas, California and Louisiana. Our small ticket commercial real estate portfolio,
which was originated on a national basis through a broker network, is in a run-off mode.
We provide additional information on the geographic concentration, by loan category, of our loan portfolio in “Note 5—Loans.”
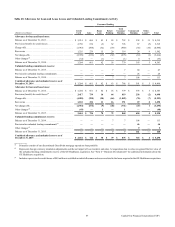
Commercial Loans
For purposes of portfolio risk management, we aggregate our commercial loan portfolio according to market segmentation primarily
based on standard industry codes. Table 17 summarizes our commercial loans held for investment portfolio by industry classification
as of December 31, 2015 and 2014.
Table 17: Commercial Loans by Industry(1)
(Percentage of portfolio)
December 31,
2015
December 31,
2014
Real estate. . . . . . . . . . . . . . . . . . . . . . . . . . . . . . . . . . . . . . . . . . . . . . . . . . . . . . . . . . . . . . . . . . . . . . . . . . . . 39% 41%
Healthcare. . . . . . . . . . . . . . . . . . . . . . . . . . . . . . . . . . . . . . . . . . . . . . . . . . . . . . . . . . . . . . . . . . . . . . . . . . . . 15 5
Finance and insurance . . . . . . . . . . . . . . . . . . . . . . . . . . . . . . . . . . . . . . . . . . . . . . . . . . . . . . . . . . . . . . . . . . 12 12
Oil and gas(2). . . . . . . . . . . . . . . . . . . . . . . . . . . . . . . . . . . . . . . . . . . . . . . . . . . . . . . . . . . . . . . . . . . . . . . . . . 57
Business services . . . . . . . . . . . . . . . . . . . . . . . . . . . . . . . . . . . . . . . . . . . . . . . . . . . . . . . . . . . . . . . . . . . . . . 45
Public administration . . . . . . . . . . . . . . . . . . . . . . . . . . . . . . . . . . . . . . . . . . . . . . . . . . . . . . . . . . . . . . . . . . . 45
Construction and land. . . . . . . . . . . . . . . . . . . . . . . . . . . . . . . . . . . . . . . . . . . . . . . . . . . . . . . . . . . . . . . . . . . 44
Educational services. . . . . . . . . . . . . . . . . . . . . . . . . . . . . . . . . . . . . . . . . . . . . . . . . . . . . . . . . . . . . . . . . . . . 44
Retail trade . . . . . . . . . . . . . . . . . . . . . . . . . . . . . . . . . . . . . . . . . . . . . . . . . . . . . . . . . . . . . . . . . . . . . . . . . . . 34
Transportation(3) . . . . . . . . . . . . . . . . . . . . . . . . . . . . . . . . . . . . . . . . . . . . . . . . . . . . . . . . . . . . . . . . . . . . . . . 34
Other. . . . . . . . . . . . . . . . . . . . . . . . . . . . . . . . . . . . . . . . . . . . . . . . . . . . . . . . . . . . . . . . . . . . . . . . . . . . . . . . 79
Total . . . . . . . . . . . . . . . . . . . . . . . . . . . . . . . . . . . . . . . . . . . . . . . . . . . . . . . . . . . . . . . . . . . . . . . . . . . . . . . . 100% 100%
__________
(1) Industry categories are based on our interpretation of the North American Industry Classification System codes as they pertain to each individual loan.
(2) In addition to loans outstanding, we also have unfunded lending commitments of approximately $3.4 billion to oil and gas companies as of December 31,
2015, which is included in our total unfunded lending commitments to extend credit disclosed in “Note 5—Loans.”
(3) Includes our taxi medallion lending portfolio among other portfolios.
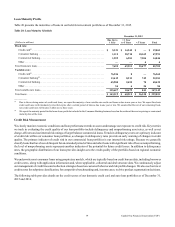
Acquired Loans
Our portfolio of loans includes certain of our consumer and commercial loans acquired in business acquisitions that were recorded
at fair value at acquisition and subsequently accounted for using the guidance for accounting for purchased credit-impaired (“PCI”)
loans and debt securities, which is based upon expected cash flows to be collected. These loans are referred to as “Acquired Loans”
or “PCI loans,” totaling $19.5 billion as of December 31, 2015 compared to $23.5 billion as of December 31, 2014. See “MD&A
—Glossary and Acronyms” for the definition of “Acquired Loans.”
The difference between the fair value at acquisition and expected cash flows represents the accretable yield, which is recognized
in interest income over the life of the loans. The difference between the contractual payments on the loans and expected cash flows
represents the nonaccretable difference or the amount of principal and interest not considered collectible, which incorporates future
expected credit losses over the life of the loans. We regularly update our estimate of expected principal and interest to be collected
from these loans and evaluate the results for each accounting pool that was established at acquisition based on loans with common
risk characteristics. Probable decreases in expected cash flows would trigger the recognition of an allowance for loan and lease
losses through our provision for credit losses. Probable and significant increases in expected cash flows would first reverse any
previously recorded allowance for loan and lease losses established subsequent to acquisition, with any remaining increase in
expected cash flows recognized prospectively in interest income over the remaining estimated life of the underlying loans. See
“Note 1—Summary of Significant Accounting Policies” for additional information on Acquired Loans that are accounted for based
on expected cash flows.