Capital One 2015 Annual Report Download - page 73
Download and view the complete annual report
Please find page 73 of the 2015 Capital One annual report below. You can navigate through the pages in the report by either clicking on the pages listed below, or by using the keyword search tool below to find specific information within the annual report.-
 1
1 -
2
-
3
-
4
-
5
-
6
-
7
-
8
-
9
-
10
-
11
-
12
-
13
-
14
-
15
-
16
-
17
-
18
-
19
-
20
-
21
-
22
-
23
-
24
-
25
-
26
-
27
-
28
-
29
-
30
-
31
-
32
-
33
-
34
-
35
-
36
-
37
-
38
-
39
-
40
-
41
-
42
-
43
-
44
-
45
-
46
-
47
-
48
-
49
-
50
-
51
-
52
-
53
-
54
-
55
-
56
-
57
-
58
-
59
-
60
-
61
-
62
-
 63
63 -
 64
64 -
 65
65 -
 66
66 -
 67
67 -
 68
68 -
 69
69 -
 70
70 -
 71
71 -
 72
72 -
 73
73 -
 74
74 -
 75
75 -
 76
76 -
 77
77 -
 78
78 -
 79
79 -
 80
80 -
 81
81 -
 82
82 -
 83
83 -
84
-
85
-
86
-
87
-
88
-
89
-
90
-
91
-
92
-
93
-
94
-
95
-
96
-
97
-
98
-
99
-
100
-
101
-
102
-
103
-
104
-
105
-
106
-
107
-
108
-
109
-
110
-
111
-
112
-
113
-
114
-
115
-
116
-
117
-
118
-
119
-
120
-
121
-
122
-
123
-
124
-
125
-
126
-
127
-
128
-
129
-
130
-
131
-
132
-
133
-
134
-
135
-
136
-
137
-
138
-
139
-
140
-
141
-
142
-
143
-
144
-
145
-
146
-
147
-
148
-
149
-
150
-
151
-
152
-
153
-
154
-
155
-
156
-
157
-
158
-
159
-
160
-
161
-
162
-
163
-
164
-
165
-
166
-
167
-
168
-
169
-
170
-
171
-
172
-
173
-
174
-
175
-
176
-
177
-
178
-
179
-
180
-
181
-
182
-
183
-
184
-
185
-
186
-
187
-
188
-
189
-
190
-
191
-
192
-
193
-
194
-
195
-
196
-
197
-
198
-
199
-
200
-
201
-
202
-
203
-
204
-
205
-
206
-
207
-
208
-
209
-
210
-
211
-
212
-
213
-
214
-
215
-
216
-
217
-
218
-
219
-
220
-
221
-
222
-
223
-
224
-
225
-
226
-
227
-
228
-
229
-
230
-
231
-
232
-
233
-
234
-
235
-
236
-
237
-
238
-
239
-
240
-
241
-
242
-
243
-
244
-
245
-
246
-
247
-
248
-
249
-
250
-
251
-
252
-
253
 |
 |

54 Capital One Financial Corporation (COF)
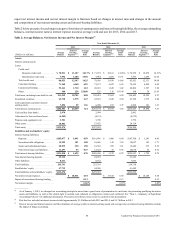
(Dollars in millions)
December 31,
2015
December 31,
2014 Change
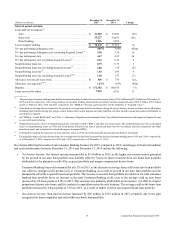
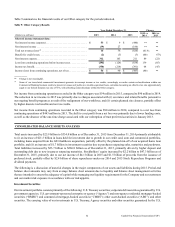
Selected period-end data:
Loans held for investment(2) . . . . . . . . . . . . . . . . . . . . . . . . . . . . . . . . . $ 87,939 $ 77,704 13%
30+ day delinquency rate . . . . . . . . . . . . . . . . . . . . . . . . . . . . . . . . . . . 3.39% 3.27% 12bps
Allowance for loan and lease losses. . . . . . . . . . . . . . . . . . . . . . . . . . . $ 3,355 $ 2,878 17%
Allowance coverage ratio(7) . . . . . . . . . . . . . . . . . . . . . . . . . . . . . . . . . . . . . . . . 3.82% 3.70% 12bps
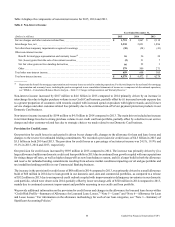
__________
(1) We recognize billed finance charges and fee income on open-ended loans in accordance with the contractual provisions of the credit arrangements and
estimate the uncollectible amount on a quarterly basis. The estimated uncollectible amount of billed finance charges and fees is reflected as a reduction in
revenue and is not included in our net charge-offs.
(2) Period-end loans held for investment and average loans held for investment include accrued finance charges and fees, net of the estimated uncollectible
amount.
(3) Calculated by dividing interest income for the period by average loans held for investment during the period for the specified loan category. Interest income
includes interest income on loans held for sale and excludes various allocations including funds transfer pricing that assigns certain balance sheet assets,
deposits and other liabilities and their related revenue and expenses attributable to each business segment. The transfer of the Best Buy loan portfolio from
loans held for investment to loans held for sale resulted in an increase in the average yield for the Domestic Card business of 99 basis points in 2013.
(4) Calculated by dividing total net revenue for the period by average loans held for investment during the period. The transfer of the Best Buy loan portfolio
from loans held for investment to loans held for sale resulted in an increase in the net revenue margin for the Domestic Card business of 111 basis points in
2013.
(5) Represents the net reduction in interest income attributable to the amortization of premiums on purchased loans accounted for based on contractual cash
flows and the accretion of other intangibles associated with the 2012 U.S. card acquisition.
(6) Consists of domestic card purchase transactions, net of returns, for the period for both loans classified as held for investment and loans classified as held for
sale. Excludes cash advance and balance transfer transactions.
(7) Calculated by dividing the allowance for loan and lease losses as of the end of the period by period-end loans held for investment.
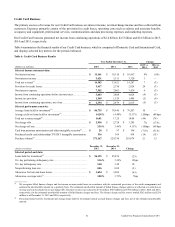
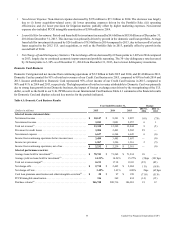
Because our Domestic Card business accounts for the substantial majority of our Credit Card business, the key factors driving the
results discussed above are similar to the key factors affecting our total Credit Card business. Net income for our Domestic Card
business remained flat in 2015, compared to 2014 as continued loan growth drove increases in both revenue and expenses, including
provision for credit losses, and operating and marketing expenses.
The primary driver of the decline in net income for our Domestic Card business in 2014, compared to 2013, was a decrease in
revenue primarily driven by the Portfolio Sale and higher marketing expenses, partially offset by lower acquisition-related costs
and provision for litigation matters, as well as lower operating expenses attributable to the Portfolio Sale in 2013 and operating
efficiencies.
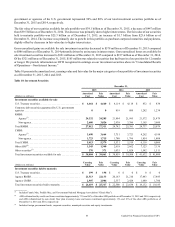
International Card Business
International Card generated net income from continuing operations of $122 million, $240 million and $234 million in 2015, 2014
and 2013, respectively. The decrease of net income in 2015, compared to 2014 was primarily due to a build of $147 million in our
U.K. PPI Reserve in 2015, which resulted in a reduction to net revenue and an increase in non-interest expense, and the impact of
foreign exchange rates driven by the strengthening of the U.S. dollar in 2015.
The increase of net income in 2014, compared to 2013, was primarily due to a lower provision for credit losses, attributable to
lower net charge-offs resulting from credit improvement, partially offset by lower non-interest income due to a decrease in service
charges and other customer-related fees.