Capital One 2015 Annual Report Download - page 82
Download and view the complete annual report
Please find page 82 of the 2015 Capital One annual report below. You can navigate through the pages in the report by either clicking on the pages listed below, or by using the keyword search tool below to find specific information within the annual report.-
 1
1 -
2
-
3
-
4
-
5
-
6
-
7
-
8
-
9
-
10
-
11
-
12
-
13
-
14
-
15
-
16
-
17
-
18
-
19
-
20
-
21
-
22
-
23
-
24
-
25
-
26
-
27
-
28
-
29
-
30
-
31
-
32
-
33
-
34
-
35
-
36
-
37
-
38
-
39
-
40
-
41
-
42
-
43
-
44
-
45
-
46
-
47
-
48
-
49
-
50
-
51
-
52
-
53
-
54
-
55
-
56
-
57
-
58
-
59
-
60
-
61
-
62
-
63
-
64
-
65
-
66
-
67
-
68
-
69
-
70
-
71
-
 72
72 -
 73
73 -
 74
74 -
 75
75 -
 76
76 -
 77
77 -
 78
78 -
 79
79 -
 80
80 -
 81
81 -
 82
82 -
 83
83 -
 84
84 -
 85
85 -
 86
86 -
 87
87 -
 88
88 -
 89
89 -
 90
90 -
 91
91 -
 92
92 -
93
-
94
-
95
-
96
-
97
-
98
-
99
-
100
-
101
-
102
-
103
-
104
-
105
-
106
-
107
-
108
-
109
-
110
-
111
-
112
-
113
-
114
-
115
-
116
-
117
-
118
-
119
-
120
-
121
-
122
-
123
-
124
-
125
-
126
-
127
-
128
-
129
-
130
-
131
-
132
-
133
-
134
-
135
-
136
-
137
-
138
-
139
-
140
-
141
-
142
-
143
-
144
-
145
-
146
-
147
-
148
-
149
-
150
-
151
-
152
-
153
-
154
-
155
-
156
-
157
-
158
-
159
-
160
-
161
-
162
-
163
-
164
-
165
-
166
-
167
-
168
-
169
-
170
-
171
-
172
-
173
-
174
-
175
-
176
-
177
-
178
-
179
-
180
-
181
-
182
-
183
-
184
-
185
-
186
-
187
-
188
-
189
-
190
-
191
-
192
-
193
-
194
-
195
-
196
-
197
-
198
-
199
-
200
-
201
-
202
-
203
-
204
-
205
-
206
-
207
-
208
-
209
-
210
-
211
-
212
-
213
-
214
-
215
-
216
-
217
-
218
-
219
-
220
-
221
-
222
-
223
-
224
-
225
-
226
-
227
-
228
-
229
-
230
-
231
-
232
-
233
-
234
-
235
-
236
-
237
-
238
-
239
-
240
-
241
-
242
-
243
-
244
-
245
-
246
-
247
-
248
-
249
-
250
-
251
-
252
-
253
 |
 |

63 Capital One Financial Corporation (COF)
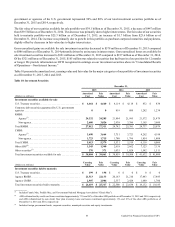
government or agencies of the U.S. government represented 90% and 86% of our total investment securities portfolio as of
December 31, 2015 and 2014, respectively.
The fair value of our securities available for sale portfolio was $39.1 billion as of December 31, 2015, a decrease of $447 million
from $39.5 billion as of December 31, 2014. The decrease was primarily due to higher interest rates. The fair value of our securities
held to maturity portfolio was $25.3 billion as of December 31, 2015, an increase of $1.7 billion from $23.6 billion as of
December 31, 2014. The increase was primarily due to growth in this portfolio as purchases outpaced maturities and paydowns,
slightly offset by decreases in fair value due to higher interest rates.
Gross unrealized gains on available for sale investment securities decreased to $578 million as of December 31, 2015 compared
to $886 million as of December 31, 2014 primarily driven by an increase in interest rates. Gross unrealized losses on available for
sale investment securities increased to $321 million as of December 31, 2015 compared to $237 million as of December 31, 2014.
Of the $321 million as of December 31, 2015, $165 million was related to securities that had been in a loss position for 12 months
or longer. We provide information on OTTI recognized in earnings on our investment securities above in “Consolidated Results
of Operations—Non-Interest Income.”
Table 10 presents the amortized cost, carrying value and fair value for the major categories of our portfolio of investment securities
as of December 31, 2015, 2014 and 2013.
Table 10: Investment Securities
December 31,
2015 2014 2013
(Dollars in millions)
Amortized
Cost
Fair
Value
Amortized
Cost
Fair
Value
Amortized
Cost
Fair
Value
Investment securities available for sale
U.S. Treasury securities . . . . . . . . . . . . . . . . . . . . . . . . . . . . . . . $ 4,664 $ 4,660 $ 4,114 $ 4,118 $ 832 $ 834
Corporate debt securities guaranteed by U.S. government
agencies . . . . . . . . . . . . . . . . . . . . . . . . . . . . . . . . . . . . . . . . . . . 0 0 819 800 1,282 1,234
RMBS:
Agency(1). . . . . . . . . . . . . . . . . . . . . . . . . . . . . . . . . . . . . . . . 24,332 24,285 21,804 21,995 21,572 21,479
Non-agency. . . . . . . . . . . . . . . . . . . . . . . . . . . . . . . . . . . . . . 2,680 3,026 2,938 3,386 3,165 3,600
Total RMBS. . . . . . . . . . . . . . . . . . . . . . . . . . . . . . . . . . . . . . . . 27,012 27,311 24,742 25,381 24,737 25,079
CMBS:
Agency(1). . . . . . . . . . . . . . . . . . . . . . . . . . . . . . . . . . . . . . . . 3,690 3,664 3,751 3,723 4,262 4,198
Non-agency. . . . . . . . . . . . . . . . . . . . . . . . . . . . . . . . . . . . . . 1,723 1,715 1,780 1,796 1,854 1,808
Total CMBS. . . . . . . . . . . . . . . . . . . . . . . . . . . . . . . . . . . . . . . . 5,413 5,379 5,531 5,519 6,116 6,006
Other ABS(2) . . . . . . . . . . . . . . . . . . . . . . . . . . . . . . . . . . . . . . . . 1,345 1,340 2,618 2,662 7,123 7,136
Other securities(3) . . . . . . . . . . . . . . . . . . . . . . . . . . . . . . . . . . . . 370 371 1,035 1,028 1,542 1,511
Total investment securities available for sale . . . . . . . . . . . . . . $ 38,804 $ 39,061 $ 38,859 $ 39,508 $ 41,632 $ 41,800
(Dollars in millions)
Carrying
Value
Fair
Value
Carrying
Value
Fair
Value
Carrying
Value
Fair
Value
Investment securities held to maturity
U.S. Treasury securities . . . . . . . . . . . . . . . . . . . . . . . . . . . . . . . $ 199 $ 198 $ 0 $ 0 $ 0 $ 0
Agency RMBS. . . . . . . . . . . . . . . . . . . . . . . . . . . . . . . . . . . . . . 21,513 22,133 20,163 21,210 17,443 17,485
Agency CMBS. . . . . . . . . . . . . . . . . . . . . . . . . . . . . . . . . . . . . . 2,907 2,986 2,337 2,424 1,689 1,700
Total investment securities held to maturity . . . . . . . . . . . . . . . $ 24,619 $ 25,317 $ 22,500 $ 23,634 $ 19,132 $ 19,185
__________
(1) Includes Fannie Mae, Freddie Mac, and Government National Mortgage Association (“Ginnie Mae”).
(2) ABS collateralized by credit card loans constituted approximately 71% and 56% of the other ABS portfolio as of December 31, 2015 and 2014, respectively,
and ABS collateralized by auto dealer floor plan inventory loans and leases constituted approximately 11% and 16% of the other ABS portfolio as of
December 31, 2015 and 2014, respectively.
(3) Includes foreign government bonds, corporate securities, municipal securities and equity investments.