Capital One 2015 Annual Report Download - page 21
Download and view the complete annual report
Please find page 21 of the 2015 Capital One annual report below. You can navigate through the pages in the report by either clicking on the pages listed below, or by using the keyword search tool below to find specific information within the annual report.-
 1
1 -
2
-
3
-
4
-
5
-
6
-
7
-
8
-
9
-
10
-
 11
11 -
 12
12 -
 13
13 -
 14
14 -
 15
15 -
 16
16 -
 17
17 -
 18
18 -
 19
19 -
 20
20 -
 21
21 -
 22
22 -
 23
23 -
 24
24 -
 25
25 -
 26
26 -
 27
27 -
 28
28 -
 29
29 -
 30
30 -
 31
31 -
32
-
33
-
34
-
35
-
36
-
37
-
38
-
39
-
40
-
41
-
42
-
43
-
44
-
45
-
46
-
47
-
48
-
49
-
50
-
51
-
52
-
53
-
54
-
55
-
56
-
57
-
58
-
59
-
60
-
61
-
62
-
63
-
64
-
65
-
66
-
67
-
68
-
69
-
70
-
71
-
72
-
73
-
74
-
75
-
76
-
77
-
78
-
79
-
80
-
81
-
82
-
83
-
84
-
85
-
86
-
87
-
88
-
89
-
90
-
91
-
92
-
93
-
94
-
95
-
96
-
97
-
98
-
99
-
100
-
101
-
102
-
103
-
104
-
105
-
106
-
107
-
108
-
109
-
110
-
111
-
112
-
113
-
114
-
115
-
116
-
117
-
118
-
119
-
120
-
121
-
122
-
123
-
124
-
125
-
126
-
127
-
128
-
129
-
130
-
131
-
132
-
133
-
134
-
135
-
136
-
137
-
138
-
139
-
140
-
141
-
142
-
143
-
144
-
145
-
146
-
147
-
148
-
149
-
150
-
151
-
152
-
153
-
154
-
155
-
156
-
157
-
158
-
159
-
160
-
161
-
162
-
163
-
164
-
165
-
166
-
167
-
168
-
169
-
170
-
171
-
172
-
173
-
174
-
175
-
176
-
177
-
178
-
179
-
180
-
181
-
182
-
183
-
184
-
185
-
186
-
187
-
188
-
189
-
190
-
191
-
192
-
193
-
194
-
195
-
196
-
197
-
198
-
199
-
200
-
201
-
202
-
203
-
204
-
205
-
206
-
207
-
208
-
209
-
210
-
211
-
212
-
213
-
214
-
215
-
216
-
217
-
218
-
219
-
220
-
221
-
222
-
223
-
224
-
225
-
226
-
227
-
228
-
229
-
230
-
231
-
232
-
233
-
234
-
235
-
236
-
237
-
238
-
239
-
240
-
241
-
242
-
243
-
244
-
245
-
246
-
247
-
248
-
249
-
250
-
251
-
252
-
253
 |
 |

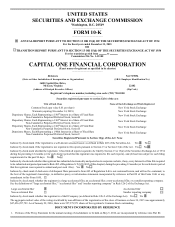
2 Capital One Financial Corporation (COF)
we acquired a mortgage servicing portfolio on approximately $10 billion of loans. Beech Street Capital was renamed Capital
One Multifamily Finance in 2014.
• On September 6, 2013, we completed the sale of the Best Buy private label and co-branded credit card portfolio to Citibank,
N.A. (“Portfolio Sale”). Pursuant to the agreement with Citibank, N.A., we received $6.4 billion for the net portfolio assets.
See “Note 2—Business Developments” for additional information on our business acquisitions and dispositions.
Additional Information
Our common stock trades on the New York Stock Exchange (“NYSE”) under the symbol “COF” and is included in the Standard
& Poor’s (“S&P”) 100 Index. Our principal executive office is located at 1680 Capital One Drive, McLean, Virginia 22102,
telephone number (703) 720-1000. We maintain a website at www.capitalone.com. Documents available on our website include:
(i) our Code of Business Conduct and Ethics for the Corporation; (ii) our Corporate Governance Guidelines; and (iii) charters for
the Audit, Compensation, Governance and Nominating, and Risk Committees of the Board of Directors. These documents also
are available in print to any stockholder who requests a copy.
In addition, we make available free of charge through our website our Annual Reports on Form 10-K, Quarterly Reports on Form 10-
Q, Current Reports on Form 8-K and amendments to those reports as soon as reasonably practicable after electronically filing or
furnishing such material to the U.S. Securities and Exchange Commission (“SEC”).
OPERATIONS AND BUSINESS SEGMENTS
Our consolidated total net revenues are derived primarily from lending to consumer and commercial customers net of funding
costs associated with deposits, short-term borrowings and long-term debt. We also earn non-interest income which primarily
consists of interchange income net of reward expenses, and service charges and other customer-related fees. Our expenses primarily
consist of the provision for credit losses, operating expenses (including salaries and associate benefits, occupancy and equipment
costs, professional services, communication and data processing expenses and other miscellaneous expenses), marketing expenses
and income taxes.
Our principal operations are currently organized for management reporting purposes into three primary business segments, which
are defined primarily based on the products and services provided or the type of customer served: Credit Card, Consumer Banking
and Commercial Banking. The operations of acquired businesses have been integrated into our existing business segments. Certain
activities that are not part of a segment, such as management of our corporate investment portfolio and asset/liability management
by our centralized Corporate Treasury group, are included in the Other category.
• Credit Card: Consists of our domestic consumer and small business card lending, and the international card lending
businesses in Canada and the United Kingdom.
• Consumer Banking: Consists of our branch-based lending and deposit gathering activities for consumers and small
businesses, national deposit gathering, national auto lending and consumer home loan lending and servicing activities.
• Commercial Banking: Consists of our lending, deposit gathering and treasury management services to commercial real
estate and commercial and industrial customers. Our commercial and industrial customers typically include companies with
annual revenues between $10 million and $1 billion.
Customer usage and payment patterns, credit quality, levels of marketing expense and operating efficiency all affect our profitability.
In our Credit Card business, we experience fluctuations in purchase volume and the level of outstanding loan receivables due to
higher seasonal consumer spending and payment patterns around the winter holiday season, summer vacations and back-to-school
periods. No individual quarter in 2015, 2014 or 2013 accounted for more than 30% of our total revenues in any of these fiscal
years. Net charge-off rates in our Credit Card and Consumer Banking businesses also have historically exhibited seasonal patterns
and generally tend to be the highest in the first and fourth quarters of the year.
For additional information on our business segments, including the financial performance of each business, see “Part II—Item 7.
Management’s Discussion and Analysis of Financial Condition and Results of Operations (“MD&A”)—Executive Summary and
Business Outlook,” “MD&A—Business Segment Financial Performance” and “Note 20—Business Segments” of this Report.