Capital One 2015 Annual Report Download - page 100
Download and view the complete annual report
Please find page 100 of the 2015 Capital One annual report below. You can navigate through the pages in the report by either clicking on the pages listed below, or by using the keyword search tool below to find specific information within the annual report.-
 1
1 -
2
-
3
-
4
-
5
-
6
-
7
-
8
-
9
-
10
-
11
-
12
-
13
-
14
-
15
-
16
-
17
-
18
-
19
-
20
-
21
-
22
-
23
-
24
-
25
-
26
-
27
-
28
-
29
-
30
-
31
-
32
-
33
-
34
-
35
-
36
-
37
-
38
-
39
-
40
-
41
-
42
-
43
-
44
-
45
-
46
-
47
-
48
-
49
-
50
-
51
-
52
-
53
-
54
-
55
-
56
-
57
-
58
-
59
-
60
-
61
-
62
-
63
-
64
-
65
-
66
-
67
-
68
-
69
-
70
-
71
-
72
-
73
-
74
-
75
-
76
-
77
-
78
-
79
-
80
-
81
-
82
-
83
-
84
-
85
-
86
-
87
-
88
-
89
-
 90
90 -
 91
91 -
 92
92 -
 93
93 -
 94
94 -
 95
95 -
 96
96 -
 97
97 -
 98
98 -
 99
99 -
 100
100 -
 101
101 -
 102
102 -
 103
103 -
 104
104 -
 105
105 -
 106
106 -
 107
107 -
 108
108 -
 109
109 -
 110
110 -
111
-
112
-
113
-
114
-
115
-
116
-
117
-
118
-
119
-
120
-
121
-
122
-
123
-
124
-
125
-
126
-
127
-
128
-
129
-
130
-
131
-
132
-
133
-
134
-
135
-
136
-
137
-
138
-
139
-
140
-
141
-
142
-
143
-
144
-
145
-
146
-
147
-
148
-
149
-
150
-
151
-
152
-
153
-
154
-
155
-
156
-
157
-
158
-
159
-
160
-
161
-
162
-
163
-
164
-
165
-
166
-
167
-
168
-
169
-
170
-
171
-
172
-
173
-
174
-
175
-
176
-
177
-
178
-
179
-
180
-
181
-
182
-
183
-
184
-
185
-
186
-
187
-
188
-
189
-
190
-
191
-
192
-
193
-
194
-
195
-
196
-
197
-
198
-
199
-
200
-
201
-
202
-
203
-
204
-
205
-
206
-
207
-
208
-
209
-
210
-
211
-
212
-
213
-
214
-
215
-
216
-
217
-
218
-
219
-
220
-
221
-
222
-
223
-
224
-
225
-
226
-
227
-
228
-
229
-
230
-
231
-
232
-
233
-
234
-
235
-
236
-
237
-
238
-
239
-
240
-
241
-
242
-
243
-
244
-
245
-
246
-
247
-
248
-
249
-
250
-
251
-
252
-
253
 |
 |

81 Capital One Financial Corporation (COF)
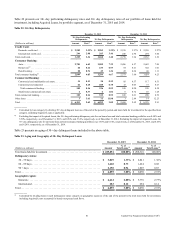
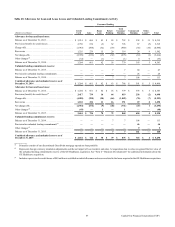
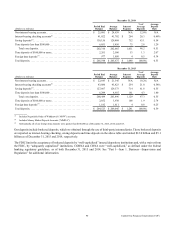
Table 22 presents our 30+ day performing delinquency rates and 30+ day delinquency rates of our portfolio of loans held for
investment, including Acquired Loans, by portfolio segment, as of December 31, 2015 and 2014.
Table 22: 30+ Day Delinquencies
December 31, 2015 December 31, 2014
30+ Day Performing
Delinquencies 30+ Day Delinquencies
30+ Day Performing
Delinquencies 30+ Day Delinquencies
(Dollars in millions) Amount Rate(1) Amount Rate(1) Amount Rate(1) Amount Rate(1)
Credit Card:
Domestic credit card . . . . . . . . . . . . . . . . . . . . . . . . . . . $ 2,985 3.39% $ 2,985 3.39% $ 2,538 3.27% $ 2,538 3.27%
International credit card. . . . . . . . . . . . . . . . . . . . . . . . . 244 2.98 283 3.46 240 2.94 294 3.60
Total credit card. . . . . . . . . . . . . . . . . . . . . . . . . . . . . . . . . . 3,229 3.36 3,268 3.40 2,778 3.24 2,832 3.30
Consumer Banking:
Auto . . . . . . . . . . . . . . . . . . . . . . . . . . . . . . . . . . . . . . . . 2,781 6.69 3,000 7.22 2,486 6.57 2,682 7.09
Home loan(2) . . . . . . . . . . . . . . . . . . . . . . . . . . . . . . . . . 40 0.16 235 0.93 64 0.21 302 1.01
Retail banking . . . . . . . . . . . . . . . . . . . . . . . . . . . . . . . . 28 0.76 49 1.36 23 0.64 40 1.11
Total consumer banking(2) . . . . . . . . . . . . . . . . . . . . . . . . . . 2,849 4.05 3,284 4.67 2,573 3.60 3,024 4.23
Commercial Banking:
Commercial and multifamily real estate . . . . . . . . . . . . 34 0.13 38 0.15 85 0.37 117 0.51
Commercial and industrial . . . . . . . . . . . . . . . . . . . . . . 66 0.18 288 0.78 15 0.05 73 0.27
Total commercial lending. . . . . . . . . . . . . . . . . . . . . . 100 0.16 326 0.52 100 0.20 190 0.38
Small-ticket commercial real estate . . . . . . . . . . . . . . . 2 0.37 6 1.04 6 0.72 10 1.28
Total commercial banking. . . . . . . . . . . . . . . . . . . . . . . . . . 102 0.16 332 0.52 106 0.21 200 0.39
Other loans . . . . . . . . . . . . . . . . . . . . . . . . . . . . . . . . . . . . . 3 3.61 11 11.98 3 2.84 14 12.23
Total. . . . . . . . . . . . . . . . . . . . . . . . . . . . . . . . . . . . . . . . . . . $ 6,183 2.69 $ 6,895 3.00 $ 5,460 2.62 $ 6,070 2.91
__________
(1) Calculated by loan category by dividing 30+ day delinquent loans as of the end of the period by period-end loans held for investment for the specified loan
category, including Acquired Loans as applicable.
(2) Excluding the impact of Acquired Loans, the 30+ day performing delinquency rate for our home loan and total consumer banking portfolios was 0.60% and
5.50%, respectively, as of December 31, 2015, and 0.94% and 5.34%, respectively, as of December 31, 2014. Excluding the impact of Acquired Loans, the
30+ day delinquency rate for our home loan and total consumer banking portfolios was 3.50% and 6.34%, respectively, as of December 31, 2015, and 4.45%
and 6.28%, respectively, as of December 31, 2014.
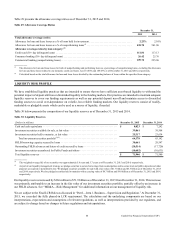
Table 23 presents an aging of 30+ day delinquent loans included in the above table.
Table 23: Aging and Geography of 30+ Day Delinquent Loans
December 31, 2015 December 31, 2014
(Dollars in millions) Amount
% of
Total Loans(1) Amount
% of
Total Loans(1)
Total loans held for investment . . . . . . . . . . . . . . . . . . . . . . . . . . . . . . . . . . . . . . . . . $ 229,851 100.00% $ 208,316 100.00%
Delinquency status:
30 – 59 days . . . . . . . . . . . . . . . . . . . . . . . . . . . . . . . . . . . . . . . . . . . . . . . . . . . . . $ 3,069 1.33% $ 2,841 1.36%
60 – 89 days . . . . . . . . . . . . . . . . . . . . . . . . . . . . . . . . . . . . . . . . . . . . . . . . . . . . . 1,668 0.73 1,424 0.68
90 + days. . . . . . . . . . . . . . . . . . . . . . . . . . . . . . . . . . . . . . . . . . . . . . . . . . . . . . . . 2,158 0.94 1,805 0.87
Total . . . . . . . . . . . . . . . . . . . . . . . . . . . . . . . . . . . . . . . . . . . . . . . . . . . . . . . . . . . . . . $ 6,895 3.00% $ 6,070 2.91%
Geographic region:
Domestic. . . . . . . . . . . . . . . . . . . . . . . . . . . . . . . . . . . . . . . . . . . . . . . . . . . . . . . . $ 6,612 2.88% $ 5,776 2.77%
International . . . . . . . . . . . . . . . . . . . . . . . . . . . . . . . . . . . . . . . . . . . . . . . . . . . . . 283 0.12 294 0.14
Total . . . . . . . . . . . . . . . . . . . . . . . . . . . . . . . . . . . . . . . . . . . . . . . . . . . . . . . . . . . . . . $ 6,895 3.00% $ 6,070 2.91%
__________
(1) Calculated by dividing loans in each delinquency status category or geographic region as of the end of the period by the total loans held for investment,
including Acquired Loans accounted for based on expected cash flows.