Capital One 2015 Annual Report Download - page 108
Download and view the complete annual report
Please find page 108 of the 2015 Capital One annual report below. You can navigate through the pages in the report by either clicking on the pages listed below, or by using the keyword search tool below to find specific information within the annual report.-
 1
1 -
2
-
3
-
4
-
5
-
6
-
7
-
8
-
9
-
10
-
11
-
12
-
13
-
14
-
15
-
16
-
17
-
18
-
19
-
20
-
21
-
22
-
23
-
24
-
25
-
26
-
27
-
28
-
29
-
30
-
31
-
32
-
33
-
34
-
35
-
36
-
37
-
38
-
39
-
40
-
41
-
42
-
43
-
44
-
45
-
46
-
47
-
48
-
49
-
50
-
51
-
52
-
53
-
54
-
55
-
56
-
57
-
58
-
59
-
60
-
61
-
62
-
63
-
64
-
65
-
66
-
67
-
68
-
69
-
70
-
71
-
72
-
73
-
74
-
75
-
76
-
77
-
78
-
79
-
80
-
81
-
82
-
83
-
84
-
85
-
86
-
87
-
88
-
89
-
90
-
91
-
92
-
93
-
94
-
95
-
96
-
97
-
 98
98 -
 99
99 -
 100
100 -
 101
101 -
 102
102 -
 103
103 -
 104
104 -
 105
105 -
 106
106 -
 107
107 -
 108
108 -
 109
109 -
 110
110 -
 111
111 -
 112
112 -
 113
113 -
 114
114 -
 115
115 -
 116
116 -
 117
117 -
 118
118 -
119
-
120
-
121
-
122
-
123
-
124
-
125
-
126
-
127
-
128
-
129
-
130
-
131
-
132
-
133
-
134
-
135
-
136
-
137
-
138
-
139
-
140
-
141
-
142
-
143
-
144
-
145
-
146
-
147
-
148
-
149
-
150
-
151
-
152
-
153
-
154
-
155
-
156
-
157
-
158
-
159
-
160
-
161
-
162
-
163
-
164
-
165
-
166
-
167
-
168
-
169
-
170
-
171
-
172
-
173
-
174
-
175
-
176
-
177
-
178
-
179
-
180
-
181
-
182
-
183
-
184
-
185
-
186
-
187
-
188
-
189
-
190
-
191
-
192
-
193
-
194
-
195
-
196
-
197
-
198
-
199
-
200
-
201
-
202
-
203
-
204
-
205
-
206
-
207
-
208
-
209
-
210
-
211
-
212
-
213
-
214
-
215
-
216
-
217
-
218
-
219
-
220
-
221
-
222
-
223
-
224
-
225
-
226
-
227
-
228
-
229
-
230
-
231
-
232
-
233
-
234
-
235
-
236
-
237
-
238
-
239
-
240
-
241
-
242
-
243
-
244
-
245
-
246
-
247
-
248
-
249
-
250
-
251
-
252
-
253
 |
 |

89 Capital One Financial Corporation (COF)
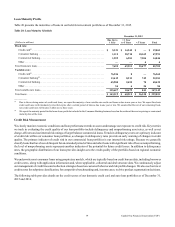
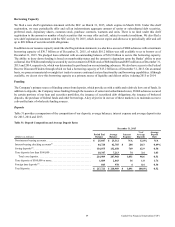
Borrowing Capacity
We filed a new shelf registration statement with the SEC on March 31, 2015, which expires in March 2018. Under this shelf
registration, we may periodically offer and sell an indeterminate aggregate amount of senior or subordinated debt securities,
preferred stock, depositary shares, common stock, purchase contracts, warrants and units. There is no limit under this shelf
registration to the amount or number of such securities that we may offer and sell, subject to market conditions. We also filed a
new shelf registration statement with the SEC on July 30, 2015, which does not expire and allows us to periodically offer and sell
up to $20 billion of securitized debt obligations.
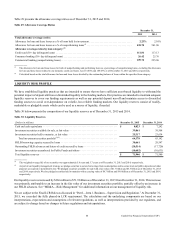
In addition to our issuance capacity under the shelf registration statements, we also have access to FHLB advances with a maximum
borrowing capacity of $30.7 billion as of December 31, 2015, of which $10.2 billion was still available to us to borrow as of
December 31, 2015. We pledged loan collateral with an outstanding balance of $36.9 billion to secure this borrowing capacity.
The ability to draw down funding is based on membership status and the amount is dependent upon the Banks’ ability to post
collateral. Our FHLB membership is secured by our investment in FHLB stock of $884 million and $807 million as of December 31,
2015 and 2014, respectively, which was determined in part based on our outstanding advances. We also have access to the Federal
Reserve Discount Window through which we had a borrowing capacity of $13.2 billion as of December 31, 2015. On an annual
basis, we process immaterial overnight test trades to ensure continued system functionality and borrowing capabilities. Although
available, we do not view this borrowing capacity as a primary source of liquidity and did not utilize it during 2015 or 2014.
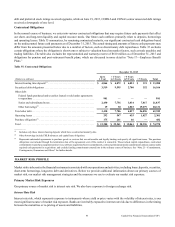
Funding
The Company’s primary source of funding comes from deposits, which provide us with a stable and relatively low cost of funds. In
addition to deposits, the Company raises funding through the issuance of senior and subordinated notes, FHLB advances secured
by certain portions of our loan and securities portfolios, the issuance of securitized debt obligations, the issuance of brokered
deposits, the purchase of federal funds and other borrowings. A key objective in our use of these markets is to maintain access to
a diversified mix of wholesale funding sources.
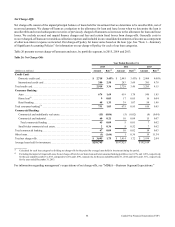
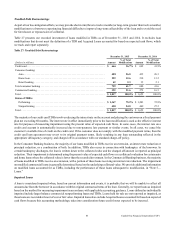
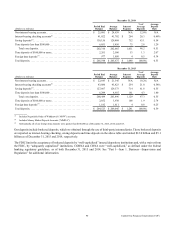
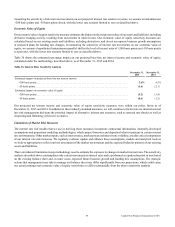
Deposits
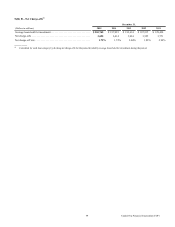
Table 31 provides a comparison of the composition of our deposits, average balances, interest expense and average deposit rates
for 2015, 2014 and 2013.
Table 31: Deposit Composition and Average Deposit Rates
December 31, 2015
(Dollars in millions)
Period End
Balance
Average
Balance
Interest
Expense
% of
Average
Deposits
Average
Deposit
Rate
Non-interest bearing accounts. . . . . . . . . . . . . . . . . . . . . . . . . . . . . . . . . . . $ 25,847 $ 25,312 N/A 12.0% N/A
Interest-bearing checking accounts(1) . . . . . . . . . . . . . . . . . . . . . . . . . . . . . 44,720 42,785 $ 208 20.3 0.49%
Saving deposits(2). . . . . . . . . . . . . . . . . . . . . . . . . . . . . . . . . . . . . . . . . . . . . 134,075 132,658 769 62.9 0.58
Time deposits less than $100,000 . . . . . . . . . . . . . . . . . . . . . . . . . . . . . . . . 10,347 7,213 74 3.4 1.03
Total core deposits . . . . . . . . . . . . . . . . . . . . . . . . . . . . . . . . . . . . . . . . . 214,989 207,968 1,051 98.6 0.51
Time deposits of $100,000 or more. . . . . . . . . . . . . . . . . . . . . . . . . . . . . . . 1,889 2,043 36 1.0 1.76
Foreign time deposits(3) . . . . . . . . . . . . . . . . . . . . . . . . . . . . . . . . . . . . . . . . 843 978 4 0.4 0.34
Total deposits. . . . . . . . . . . . . . . . . . . . . . . . . . . . . . . . . . . . . . . . . . . . . . . . $ 217,721 $ 210,989 $ 1,091 100.0% 0.52