Capital One 2015 Annual Report Download - page 78
Download and view the complete annual report
Please find page 78 of the 2015 Capital One annual report below. You can navigate through the pages in the report by either clicking on the pages listed below, or by using the keyword search tool below to find specific information within the annual report.-
 1
1 -
2
-
3
-
4
-
5
-
6
-
7
-
8
-
9
-
10
-
11
-
12
-
13
-
14
-
15
-
16
-
17
-
18
-
19
-
20
-
21
-
22
-
23
-
24
-
25
-
26
-
27
-
28
-
29
-
30
-
31
-
32
-
33
-
34
-
35
-
36
-
37
-
38
-
39
-
40
-
41
-
42
-
43
-
44
-
45
-
46
-
47
-
48
-
49
-
50
-
51
-
52
-
53
-
54
-
55
-
56
-
57
-
58
-
59
-
60
-
61
-
62
-
63
-
64
-
65
-
66
-
67
-
 68
68 -
 69
69 -
 70
70 -
 71
71 -
 72
72 -
 73
73 -
 74
74 -
 75
75 -
 76
76 -
 77
77 -
 78
78 -
 79
79 -
 80
80 -
 81
81 -
 82
82 -
 83
83 -
 84
84 -
 85
85 -
 86
86 -
 87
87 -
 88
88 -
89
-
90
-
91
-
92
-
93
-
94
-
95
-
96
-
97
-
98
-
99
-
100
-
101
-
102
-
103
-
104
-
105
-
106
-
107
-
108
-
109
-
110
-
111
-
112
-
113
-
114
-
115
-
116
-
117
-
118
-
119
-
120
-
121
-
122
-
123
-
124
-
125
-
126
-
127
-
128
-
129
-
130
-
131
-
132
-
133
-
134
-
135
-
136
-
137
-
138
-
139
-
140
-
141
-
142
-
143
-
144
-
145
-
146
-
147
-
148
-
149
-
150
-
151
-
152
-
153
-
154
-
155
-
156
-
157
-
158
-
159
-
160
-
161
-
162
-
163
-
164
-
165
-
166
-
167
-
168
-
169
-
170
-
171
-
172
-
173
-
174
-
175
-
176
-
177
-
178
-
179
-
180
-
181
-
182
-
183
-
184
-
185
-
186
-
187
-
188
-
189
-
190
-
191
-
192
-
193
-
194
-
195
-
196
-
197
-
198
-
199
-
200
-
201
-
202
-
203
-
204
-
205
-
206
-
207
-
208
-
209
-
210
-
211
-
212
-
213
-
214
-
215
-
216
-
217
-
218
-
219
-
220
-
221
-
222
-
223
-
224
-
225
-
226
-
227
-
228
-
229
-
230
-
231
-
232
-
233
-
234
-
235
-
236
-
237
-
238
-
239
-
240
-
241
-
242
-
243
-
244
-
245
-
246
-
247
-
248
-
249
-
250
-
251
-
252
-
253
 |
 |

59 Capital One Financial Corporation (COF)
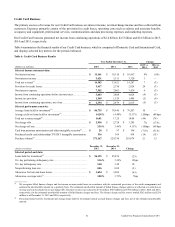
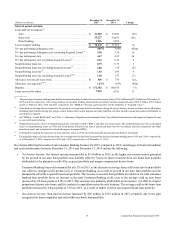
• Deposits: Period-end deposits increased by $426 million to $168.1 billion as of December 31, 2014, from December 31,
2013.
• Net Charge-off and Delinquency Statistics: The net charge-off rate increased by 10 basis points to 0.95% in 2014 compared
to 2013. The increase in the net charge-off rate reflected a shift in the mix of the portfolio toward auto loans (which typically
carry higher net charge-off rates than our home loan portfolio), as the home loan portfolio runs off. The 30+ day delinquency
rate increased by 34 basis points to 4.23% as of December 31, 2014 from December 31, 2013.
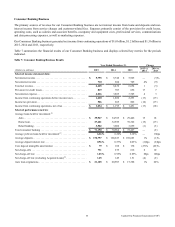
Commercial Banking Business
The primary sources of revenue for our Commercial Banking business are net interest income from loans and deposits and non-
interest income from customer fees and other transactions. Because we have some investments that generate tax-exempt income
or tax credits, we make certain reclassifications to our Commercial Banking business results to present revenues on a taxable-
equivalent basis. Expenses primarily consist of the provision for credit losses, operating costs, such as salaries and associate
benefits, occupancy, equipment, professional services, communications and data processing expenses, as well as marketing
expenses.
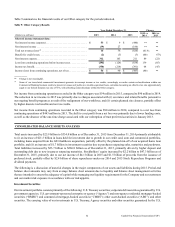
Our Commercial Banking business generated net income from continuing operations of $570 million, $659 million and $731
million in 2015, 2014 and 2013, respectively. Table 8 summarizes the financial results of our Commercial Banking business and
displays selected key metrics for the periods indicated.
Table 8: Commercial Banking Business Results
Year Ended December 31, Change
(Dollars in millions) 2015 2014 2013 2015 vs.
2014
2014 vs.
2013
Selected income statement data:
Net interest income . . . . . . . . . . . . . . . . . . . . . . . . . . . . . . . . . . . . . . . . $ 1,865 $ 1,751 $ 1,674 7% 5%
Non-interest income . . . . . . . . . . . . . . . . . . . . . . . . . . . . . . . . . . . . . . . 487 450 395 8 14
Total net revenue(1) . . . . . . . . . . . . . . . . . . . . . . . . . . . . . . . . . . . . . . . . 2,352 2,201 2,069 7 6
Provision (benefit) for credit losses(2) . . . . . . . . . . . . . . . . . . . . . . . . . . 302 93 (24) 225 **
Non-interest expense. . . . . . . . . . . . . . . . . . . . . . . . . . . . . . . . . . . . . . . 1,156 1,083 958 7 13
Income from continuing operations before income taxes. . . . . . . . . . . 894 1,025 1,135 (13) (10)
Income tax provision. . . . . . . . . . . . . . . . . . . . . . . . . . . . . . . . . . . . . . . 324 366 404 (11) (9)
Income from continuing operations, net of tax. . . . . . . . . . . . . . . . . . . $ 570 $ 659 $ 731 (14) (10)
Selected performance metrics:
Average loans held for investment:(3)
Commercial and multifamily real estate . . . . . . . . . . . . . . . . . . . . . $ 23,728 $ 22,003 $ 18,636 8 18
Commercial and industrial. . . . . . . . . . . . . . . . . . . . . . . . . . . . . . . . 28,349 25,028 21,062 13 19
Total commercial lending . . . . . . . . . . . . . . . . . . . . . . . . . . . . . . . 52,077 47,031 39,698 11 18
Small-ticket commercial real estate. . . . . . . . . . . . . . . . . . . . . . . . . 692 868 1,073 (20) (19)
Total commercial banking. . . . . . . . . . . . . . . . . . . . . . . . . . . . . . . . . . . $ 52,769 $ 47,899 $ 40,771 10 17
Average yield on loans held for investment(1) . . . . . . . . . . . . . . . . . . . . 3.21% 3.42% 3.88% (21)bps (46)bps
Average deposits. . . . . . . . . . . . . . . . . . . . . . . . . . . . . . . . . . . . . . . . . . $ 33,058 $ 31,752 $ 30,702 4% 3%
Average deposit interest rate. . . . . . . . . . . . . . . . . . . . . . . . . . . . . . . . . 0.25% 0.24% 0.27% 1bps (3)bps
Core deposit intangible amortization . . . . . . . . . . . . . . . . . . . . . . . . . . $ 15 $ 21 $ 27 (29)% (22)%
Net charge-offs . . . . . . . . . . . . . . . . . . . . . . . . . . . . . . . . . . . . . . . . . . . 47 10 14 370 (29)
Net charge-off rate . . . . . . . . . . . . . . . . . . . . . . . . . . . . . . . . . . . . . . . . 0.09% 0.02% 0.03% 7bps (1)bps