Capital One 2015 Annual Report Download - page 230
Download and view the complete annual report
Please find page 230 of the 2015 Capital One annual report below. You can navigate through the pages in the report by either clicking on the pages listed below, or by using the keyword search tool below to find specific information within the annual report.-
 1
1 -
2
-
3
-
4
-
5
-
6
-
7
-
8
-
9
-
10
-
11
-
12
-
13
-
14
-
15
-
16
-
17
-
18
-
19
-
20
-
21
-
22
-
23
-
24
-
25
-
26
-
27
-
28
-
29
-
30
-
31
-
32
-
33
-
34
-
35
-
36
-
37
-
38
-
39
-
40
-
41
-
42
-
43
-
44
-
45
-
46
-
47
-
48
-
49
-
50
-
51
-
52
-
53
-
54
-
55
-
56
-
57
-
58
-
59
-
60
-
61
-
62
-
63
-
64
-
65
-
66
-
67
-
68
-
69
-
70
-
71
-
72
-
73
-
74
-
75
-
76
-
77
-
78
-
79
-
80
-
81
-
82
-
83
-
84
-
85
-
86
-
87
-
88
-
89
-
90
-
91
-
92
-
93
-
94
-
95
-
96
-
97
-
98
-
99
-
100
-
101
-
102
-
103
-
104
-
105
-
106
-
107
-
108
-
109
-
110
-
111
-
112
-
113
-
114
-
115
-
116
-
117
-
118
-
119
-
120
-
121
-
122
-
123
-
124
-
125
-
126
-
127
-
128
-
129
-
130
-
131
-
132
-
133
-
134
-
135
-
136
-
137
-
138
-
139
-
140
-
141
-
142
-
143
-
144
-
145
-
146
-
147
-
148
-
149
-
150
-
151
-
152
-
153
-
154
-
155
-
156
-
157
-
158
-
159
-
160
-
161
-
162
-
163
-
164
-
165
-
166
-
167
-
168
-
169
-
170
-
171
-
172
-
173
-
174
-
175
-
176
-
177
-
178
-
179
-
180
-
181
-
182
-
183
-
184
-
185
-
186
-
187
-
188
-
189
-
190
-
191
-
192
-
193
-
194
-
195
-
196
-
197
-
198
-
199
-
200
-
201
-
202
-
203
-
204
-
205
-
206
-
207
-
208
-
209
-
210
-
211
-
212
-
213
-
214
-
215
-
216
-
217
-
218
-
219
-
 220
220 -
 221
221 -
 222
222 -
 223
223 -
 224
224 -
 225
225 -
 226
226 -
 227
227 -
 228
228 -
 229
229 -
 230
230 -
 231
231 -
 232
232 -
 233
233 -
 234
234 -
 235
235 -
 236
236 -
 237
237 -
 238
238 -
 239
239 -
 240
240 -
241
-
242
-
243
-
244
-
245
-
246
-
247
-
248
-
249
-
250
-
251
-
252
-
253
 |
 |

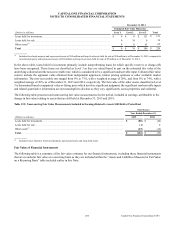
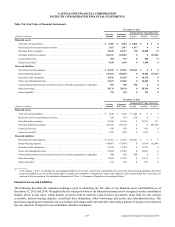
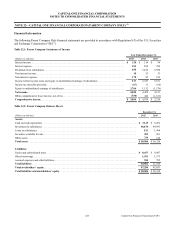
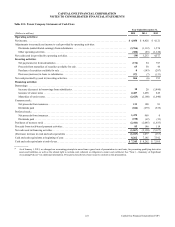
CAPITAL ONE FINANCIAL CORPORATION
NOTES TO CONSOLIDATED FINANCIAL STATEMENTS
211 Capital One Financial Corporation (COF)
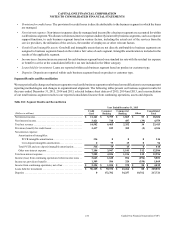
Year Ended December 31, 2014
(Dollars in millions)
Credit
Card
Consumer
Banking
Commercial
Banking Other
Consolidated
Total
Net interest income. . . . . . . . . . . . . . . . . . . . . . . . . . . . . . . . . . . . . $ 10,310 $ 5,748 $ 1,751 $ 9 $ 17,818
Non-interest income . . . . . . . . . . . . . . . . . . . . . . . . . . . . . . . . . . . . 3,311 684 450 27 4,472
Total net revenue . . . . . . . . . . . . . . . . . . . . . . . . . . . . . . . . . . . . . . 13,621 6,432 2,201 36 22,290
Provision (benefit) for credit losses . . . . . . . . . . . . . . . . . . . . . . . . 2,750 703 93 (5) 3,541
Non-interest expense:
Amortization of intangibles:
PCCR intangible amortization. . . . . . . . . . . . . . . . . . . . . . . 369 0 0 0 369
Core deposit intangible amortization. . . . . . . . . . . . . . . . . . 0 108 21 0 129
Total PCCR and core deposit intangible amortization . . . . . . . 369 108 21 0 498
Other non-interest expense . . . . . . . . . . . . . . . . . . . . . . . . . . . . 6,694 3,761 1,062 165 11,682
Total non-interest expense . . . . . . . . . . . . . . . . . . . . . . . . . . . . . . . 7,063 3,869 1,083 165 12,180
Income (loss) from continuing operations before income taxes . . 3,808 1,860 1,025 (124) 6,569
Income tax provision (benefit) . . . . . . . . . . . . . . . . . . . . . . . . . . . . 1,329 665 366 (214) 2,146
Income from continuing operations, net of tax . . . . . . . . . . . . . . . $ 2,479 $ 1,195 $ 659 $ 90 $ 4,423
Loans held for investment . . . . . . . . . . . . . . . . . . . . . . . . . . . . . . . $ 85,876 $ 71,439 $ 50,890 $ 111 $ 208,316
Deposits . . . . . . . . . . . . . . . . . . . . . . . . . . . . . . . . . . . . . . . . . . . . . 0 168,078 31,954 5,516 205,548
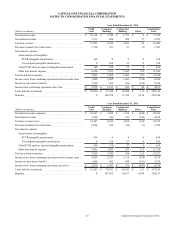
Year Ended December 31, 2013
(Dollars in millions)
Credit
Card
Consumer
Banking
Commercial
Banking Other
Consolidated
Total
Net interest income (expense) . . . . . . . . . . . . . . . . . . . . . . . . . . . . $ 10,967 $ 5,905 $ 1,674 $ (440) $ 18,106
Non-interest income . . . . . . . . . . . . . . . . . . . . . . . . . . . . . . . . . . . . 3,320 749 395 (186) 4,278
Total net revenue (loss) . . . . . . . . . . . . . . . . . . . . . . . . . . . . . . . . . 14,287 6,654 2,069 (626) 22,384
Provision (benefit) for credit losses . . . . . . . . . . . . . . . . . . . . . . . . 2,824 656 (24) (3) 3,453
Non-interest expense:
Amortization of intangibles:
PCCR intangible amortization. . . . . . . . . . . . . . . . . . . . . . . 434 0 0 0 434
Core deposit intangible amortization. . . . . . . . . . . . . . . . . . 0 138 27 0 165
Total PCCR and core deposit intangible amortization . . . . . . . 434 138 27 0 599
Other non-interest expense . . . . . . . . . . . . . . . . . . . . . . . . . . . . 7,005 3,607 931 211 11,754
Total non-interest expense . . . . . . . . . . . . . . . . . . . . . . . . . . . . . . . 7,439 3,745 958 211 12,353
Income (loss) from continuing operations before income taxes . . 4,024 2,253 1,135 (834) 6,578
Income tax provision (benefit) . . . . . . . . . . . . . . . . . . . . . . . . . . . . 1,409 802 404 (391) 2,224
Income (loss) from continuing operations, net of tax . . . . . . . . . . $ 2,615 $ 1,451 $ 731 $ (443) $ 4,354
Loans held for investment . . . . . . . . . . . . . . . . . . . . . . . . . . . . . . . $ 81,305 $ 70,762 $ 45,011 $ 121 $ 197,199
Deposits . . . . . . . . . . . . . . . . . . . . . . . . . . . . . . . . . . . . . . . . . . . . . 0 167,652 30,567 6,304 204,523