Capital One 2015 Annual Report Download - page 209
Download and view the complete annual report
Please find page 209 of the 2015 Capital One annual report below. You can navigate through the pages in the report by either clicking on the pages listed below, or by using the keyword search tool below to find specific information within the annual report.-
 1
1 -
2
-
3
-
4
-
5
-
6
-
7
-
8
-
9
-
10
-
11
-
12
-
13
-
14
-
15
-
16
-
17
-
18
-
19
-
20
-
21
-
22
-
23
-
24
-
25
-
26
-
27
-
28
-
29
-
30
-
31
-
32
-
33
-
34
-
35
-
36
-
37
-
38
-
39
-
40
-
41
-
42
-
43
-
44
-
45
-
46
-
47
-
48
-
49
-
50
-
51
-
52
-
53
-
54
-
55
-
56
-
57
-
58
-
59
-
60
-
61
-
62
-
63
-
64
-
65
-
66
-
67
-
68
-
69
-
70
-
71
-
72
-
73
-
74
-
75
-
76
-
77
-
78
-
79
-
80
-
81
-
82
-
83
-
84
-
85
-
86
-
87
-
88
-
89
-
90
-
91
-
92
-
93
-
94
-
95
-
96
-
97
-
98
-
99
-
100
-
101
-
102
-
103
-
104
-
105
-
106
-
107
-
108
-
109
-
110
-
111
-
112
-
113
-
114
-
115
-
116
-
117
-
118
-
119
-
120
-
121
-
122
-
123
-
124
-
125
-
126
-
127
-
128
-
129
-
130
-
131
-
132
-
133
-
134
-
135
-
136
-
137
-
138
-
139
-
140
-
141
-
142
-
143
-
144
-
145
-
146
-
147
-
148
-
149
-
150
-
151
-
152
-
153
-
154
-
155
-
156
-
157
-
158
-
159
-
160
-
161
-
162
-
163
-
164
-
165
-
166
-
167
-
168
-
169
-
170
-
171
-
172
-
173
-
174
-
175
-
176
-
177
-
178
-
179
-
180
-
181
-
182
-
183
-
184
-
185
-
186
-
187
-
188
-
189
-
190
-
191
-
192
-
193
-
194
-
195
-
196
-
197
-
198
-
 199
199 -
 200
200 -
 201
201 -
 202
202 -
 203
203 -
 204
204 -
 205
205 -
 206
206 -
 207
207 -
 208
208 -
 209
209 -
 210
210 -
 211
211 -
 212
212 -
 213
213 -
 214
214 -
 215
215 -
 216
216 -
 217
217 -
 218
218 -
 219
219 -
220
-
221
-
222
-
223
-
224
-
225
-
226
-
227
-
228
-
229
-
230
-
231
-
232
-
233
-
234
-
235
-
236
-
237
-
238
-
239
-
240
-
241
-
242
-
243
-
244
-
245
-
246
-
247
-
248
-
249
-
250
-
251
-
252
-
253
 |
 |

CAPITAL ONE FINANCIAL CORPORATION
NOTES TO CONSOLIDATED FINANCIAL STATEMENTS
190 Capital One Financial Corporation (COF)
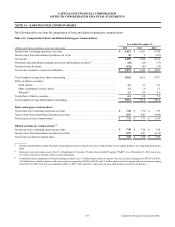
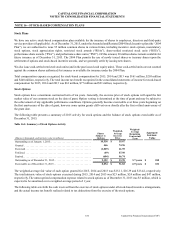
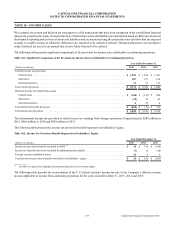
NOTE 17—EMPLOYEE BENEFIT PLANS
Defined Contribution Plan
We sponsor a contributory Associate Savings Plan (the “Plan”) in which all full-time and part-time associates over the age of 18
are eligible to participate. We make non-elective contributions to each eligible associate’s account and match a portion of associate
contributions. We also sponsor a voluntary non-qualified deferred compensation plan in which select groups of employees are
eligible to participate. We make contributions to this plan based on participants’ deferral of salary, bonuses and other eligible pay.
In addition, we match participants’ excess compensation (compensation over the Internal Revenue Service compensation limit)
less deferrals. We contributed a total of $234 million, $214 million and $206 million to these plans during the years ended December
31, 2015, 2014 and 2013, respectively.
Defined Benefit Pension and Other Postretirement Benefit Plans
We sponsor a frozen qualified defined benefit pension plan and several non-qualified defined benefit pension plans. We also sponsor
a plan that provides other postretirement benefits, including medical and life insurance coverage.
Our pension plans and the other postretirement benefit plans are valued using December 31, 2015 and 2014 measurement dates.
Our policy is to amortize prior service amounts on a straight-line basis over the average remaining years of service to full eligibility
for benefits of active plan participants.
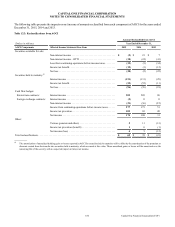
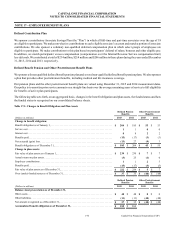
The following table sets forth, on an aggregated basis, changes in the benefit obligation and plan assets, the funded status and how
the funded status is recognized on our consolidated balance sheets.
Table 17.1: Changes in Benefit Obligation and Plan Assets
Defined Pension
Benefits
Other Postretirement
Benefits
(Dollars in millions) 2015 2014 2015 2014
Change in benefit obligation:
Benefit obligation as of January 1, . . . . . . . . . . . . . . . . . . . . . . . . . . . . . . . . . . . . . . . . . . . . . . . . $ 204 $ 185 $ 55 $ 53
Service cost. . . . . . . . . . . . . . . . . . . . . . . . . . . . . . . . . . . . . . . . . . . . . . . . . . . . . . . . . . . . . . . . . . 1100
Interest cost. . . . . . . . . . . . . . . . . . . . . . . . . . . . . . . . . . . . . . . . . . . . . . . . . . . . . . . . . . . . . . . . . . 8822
Benefits paid. . . . . . . . . . . . . . . . . . . . . . . . . . . . . . . . . . . . . . . . . . . . . . . . . . . . . . . . . . . . . . . . . (15) (17) (3) (3)
Net actuarial (gain) loss . . . . . . . . . . . . . . . . . . . . . . . . . . . . . . . . . . . . . . . . . . . . . . . . . . . . . . . . (13) 27 (9) 3
Benefit obligation as of December 31, . . . . . . . . . . . . . . . . . . . . . . . . . . . . . . . . . . . . . . . . . . . . . $ 185 $ 204 $ 45 $ 55
Change in plan assets:
Fair value of plan assets as of January 1, . . . . . . . . . . . . . . . . . . . . . . . . . . . . . . . . . . . . . . . . . . . $ 239 $ 230 $ 7 $ 7
Actual return on plan assets . . . . . . . . . . . . . . . . . . . . . . . . . . . . . . . . . . . . . . . . . . . . . . . . . . . . . (3) 25 (1) 0
Employer contributions . . . . . . . . . . . . . . . . . . . . . . . . . . . . . . . . . . . . . . . . . . . . . . . . . . . . . . . . 1123
Benefits paid. . . . . . . . . . . . . . . . . . . . . . . . . . . . . . . . . . . . . . . . . . . . . . . . . . . . . . . . . . . . . . . . . (15) (17) (3) (3)
Fair value of plan assets as of December 31, . . . . . . . . . . . . . . . . . . . . . . . . . . . . . . . . . . . . . . . . $ 222 $ 239 $ 5 $ 7
Over (under) funded status as of December 31, . . . . . . . . . . . . . . . . . . . . . . . . . . . . . . . . . . . . . . $ 37 $ 35 $ (40) $ (48)
Defined Pension
Benefits
Other Postretirement
Benefits
(Dollars in millions) 2015 2014 2015 2014
Balance sheet presentation as of December 31,
Other assets. . . . . . . . . . . . . . . . . . . . . . . . . . . . . . . . . . . . . . . . . . . . . . . . . . . . . . . . . . . . . . . . . . $ 48 $ 48 $ 0 $ 0
Other liabilities . . . . . . . . . . . . . . . . . . . . . . . . . . . . . . . . . . . . . . . . . . . . . . . . . . . . . . . . . . . . . . . (11) (13) (40) (48)
Net amount recognized as of December 31,. . . . . . . . . . . . . . . . . . . . . . . . . . . . . . . . . . . . . . . . . $ 37 $ 35 $ (40) $ (48)
Accumulated benefit obligation as of December 31, . . . . . . . . . . . . . . . . . . . . . . . . . . . . . . . . $ 185 $ 204